


Fibonacci in Forex Trading
Learn how forex traders use Fibonacci retracements and extensions to identify high-value entry points, set profit targets and place effective stop losses.
.png)
You stare at charts and ask yourself, Is Forex Trading Hard when every swing feels like a guess and wins slip away. Fibonacci retracement levels provide a practical approach to identifying potential support and resistance by measuring swing highs and lows, and observing key ratios such as 38.2%, 50%, and 61.8%, as you analyze price action and trend.
This guide outlines clear, hands-on steps to plot Fibonacci levels, identify confluence with indicators and chart patterns, and utilize those zones to plan entries, stops, and targets.
To practice these setups with capital and clear rules, Goat Funded Trader offers a prop firm that funds traders, enforces risk controls, and helps you build the confidence to apply Fibonacci retracement levels in live markets without risking your own savings.
Understanding Fibonacci Retracement and Extension in Forex Trading

The Fibonacci Sequence
The Fibonacci sequence starts 1, 1, 2, 3, 5, 8, 13, and continues by adding the two previous numbers. Traders care because ratios between those numbers converge toward 0.618 and 1.618. Those ratios create practical levels that traders use as retracements and extensions. You will see 23.6, 38.2, 50, 61.8, 100, and common extension ratios, such as 127.2 and 161.8, on most charting platforms.
Fibonacci Retracement
Draw a retracement from a clear swing low to a swing high in an uptrend or the reverse in a downtrend. The tool maps horizontal levels where price often slows, reverses, or consolidates: 23.6, 38.2, 50, 61.8, and 100. Use these levels as potential entry zones during pullbacks, set stop-losses beyond the next structural level, and size your position for a favorable risk-to-reward ratio.
Look for a confluence of factors.
A 61.8 retracement that aligns with a prior support level, a moving average, or a trendline becomes a stronger trade candidate.
Ask yourself
Does price show a rejection candle, rising volume, or RSI divergence at the level before entering?
Fibonacci Extension
An extension project where the price could run once a pullback ends and the trend resumes.
Select three points
The swing start, the swing end, and the retracement low or high. The tool then plots targets beyond the swing end at ratios such as 127.2, 138.2, 150, and 161.8.
Traders use these levels to set take-profit zones, partial exits, or trailing-stop triggers while managing trade expectations and risk. Combine an extension level with visible resistance, round numbers, or a prior high to pick the most realistic target.
Pairing Retracement and Extension
Step One
Identify the dominant trend on a higher timeframe to establish your bias.
Step Two
Draw retracement levels on the last meaningful swing to spot entry zones on your preferred timeframe.
Step Three
Confirm with price action, moving averages, oscillators, or volume to avoid chasing false pullbacks.
Step Four
Use extension targets to plan exits and calculate risk-reward before placing the trade.
Use scaling out at progressively higher extension levels and move stops to breakeven once the price proves trend continuation.
Common pitfalls and tips that improve execution
Do not treat Fibonacci as a standalone signal. Combine levels with structure, order flow, and indicator confirmation for higher probability setups. Watch timeframes: higher timeframe retracements influence shorter-term moves.
Beware of crowding around obvious ratios; price often pauses at round numbers near Fibonacci levels. Backtest setups on the currency pairs and timeframes you trade to see which ratios act reliably for those markets. How much confluence do you require before you take a trade?
Goat Funded Trader gives you access to simulated accounts up to $800K with the most trader-friendly conditions in the industry, no minimum targets, no time limits, triple paydays, and up to 100% profit split, backed by a 2-day payment guarantee with a $500 penalty for delays. Choose a challenge path or instant funding, join over 98,000 traders who have collected more than $9.1 million in rewards, and sign up to get access to Up to $800K today through our prop firm.
How to Draw Fibonacci Retracement Levels in Forex Trading

How Fibonacci Retracement Helps You Spot Support and Resistance
Fibonacci retracement uses ratios from the Fibonacci sequence to mark likely support and resistance after a strong price move. Typical ratios are 23.6%, 38.2%, 50%, 61.8% and 78.6%. Traders place these horizontal lines between a swing low and swing high to identify pullback zones where price may pause, reverse, or resume the primary trend. These lines serve as reference points for entries, stop-loss placement, and profit targets.
Step by step: Drawing Retracement on an Uptrend
- Confirm the trend: verify that you have higher highs and higher lows on the timeframe you trade.
- Identify swing low and swing high: pick the significant low that started the move and the peak that ended it.
- Apply the Fibonacci tool from swing low to swing high: the charting package will plot the ratios downward across the move.
- Watch the pullback: price often reacts at 38.2% or 61.8%. Look for price action signals like pin bars, engulfing candles, or a bounce off a moving average before entering long.
- Set stops and targets: place a stop loss a few pips beyond the next lower retracement or recent swing low, and use extensions or previous highs for take profit.
Step by step: Drawing Retracement on a Downtrend
- Confirm the downtrend with lower lows and lower highs.
- Identify swing high and swing low that frame the fall.
- Apply the Fibonacci tool from swing high to swing low so ratios appear above the move.
- Use retracement zones as resistance for short entries and watch for bearish reversal candlesticks or divergence on oscillators.
- Place stop loss above the next higher retracement or recent swing high and plan targets using Fibonacci extensions or support zones.
Picking the Right Swing Points and Timeframe
Choose swing points that reflect a clear impulsive move. Avoid tiny wicks and noise; prefer points validated by candle clusters or volume.
Draw on multiple timeframes
Start with daily or 4-hour charts for major zones, then refine entries on the 1-hour or 15-minute chart. Higher timeframes yield stronger levels, while lower timeframes provide precise entry timing.
How to Use Fibonacci with Price Action and Indicators
Combine Fibonacci with moving averages, trend lines, RSI, stochastic, and volume. Confluence occurs when a 61.8% retracement line up with a 200-period moving average or central trend line. Look for RSI divergence or a candlestick reversal pattern at a Fibonacci level to increase probability. Use ATR to size positions and place stops based on volatility.
Entries, Stop Loss, and Take Profit Using Fibonacci
Enter with confirmation
A bounce candle, a break of a small structure, or an oscillator flip. Place stop loss beyond the next relevant level or a fixed ATR multiple. For targets, use Fibonacci extension levels, such as 127.2% or 161.8%, or previous swing highs and lows.
Split position sizing
Take partial profits at the 100% retracement and let the remainder run to extensions if momentum holds.
Advanced tools: Extensions, Fans, and Clusters
Fibonacci extension projects profit targets beyond the original move, using ratios such as 127.2% and 161.8%. Fibonacci fan and arcs provide diagonal support and resistance based on the same ratios. A Fibonacci cluster forms when multiple Fibonacci levels from different swings converge, creating a strong decision zone for entries or exits.
Common Mistakes and How to Avoid Them
Avoid drawing from insignificant swings or using the wrong direction when applying the tool. Do not rely on a single Fibonacci level as a trade signal. Resist changing swing points to fit a bias. Use strict trade management and confirm with price action or indicator signals before risking capital.
Practical checklist before you trade a Fibonacci setup
Which timeframe is aligned with your plan? Is the swing high and low clean and obvious? Do you see confluence with moving averages, trend lines, or oscillator signals? Where will you place a stop loss, and how much of your account will you risk? Answer these and record them before you press buy or sell.
Related Reading
- What Is A Lot Size In Forex
- How Much Do You Need To Start Trading Forex
- How Profitable Is Forex Trading
- What Is Swap In Forex Trading
- Forex Trading Account Types
- How To Learn Forex Trading
- Pros And Cons Of Forex Trading
- Forex Trading Profit Per Day
How to Trade Forex Using Fibonacci Retracements

Spot the Trend and Mark the Real Swing Points
Start with higher time frames to see who controls the price. On a daily chart, does price make higher highs and higher lows or the opposite? Confirm that direction with a 50 or 200 moving average and a simple trend line. Then zoom in to find the most recent clear swing low and swing high that define the move you want to trade. Which swing points matter most? Pick the extremes that market participants respected most recently, not every small swing that creates noise.
Use multiple time frames. Define the trend on the 4-hour or daily chart and use the 1-hour or 15-minute chart for entry refinement. Mark swing points where price paused or reversed, accompanied by volume or a strong candlestick rejection.
Drop the Fibonacci Tool and Plot Retracement Levels
Place the Fibonacci retracement from the identified swing low to swing high in an uptrend, and flip it from swing high to swing low in a downtrend. The tool will show common ratios: 23.6, 38.2, 50, 61.8, and 78.6. Treat these as zones rather than exact lines because liquidity and spread move price through thin areas.
Add extension levels for targets such as 127.2 and 161.8 when you expect the move to resume beyond the prior swing. Layer simple support and resistance, pivot points, and moving averages to find confluence where a retracement level lines up with structural areas.
Read Price Reaction and Confirm Entries
Watch how price behaves as it approaches the retracement zone. Look for clear price action cues such as pin bars, engulfing candles, or double tops and bottoms. Add momentum and strength tools like RSI divergence, MACD crossovers, or increasing volume to reduce false signals.
Ask yourself these questions before entering.
- Did the wick show rejection at the level?
- Is momentum turning in my trade direction?
- Do nearby moving averages or previous lows add weight to this zone?
Use lower time frames only to time entries when the higher time frame confirms the bias.
Plan the Trade: Entries, Stops, and Targets with Fibonacci
When price gives a bullish reversal signal at a retracement level in an uptrend, consider a long entry with a stop placed beyond the next significant Fibonacci level or structural low. In short trades, set the stop above the next retracement level or structural high. Calculate position size so the dollar risk equals your predefined risk per trade.
Set profit targets using prior swing highs or Fibonacci extension levels, such as 127.2% and 161.8%. Utilize a risk-reward approach that aligns with your edge. Do you scale out or trail the stop? Many traders take partial profits at the first target and move the stop to breakeven while letting the remainder run to a higher extension.
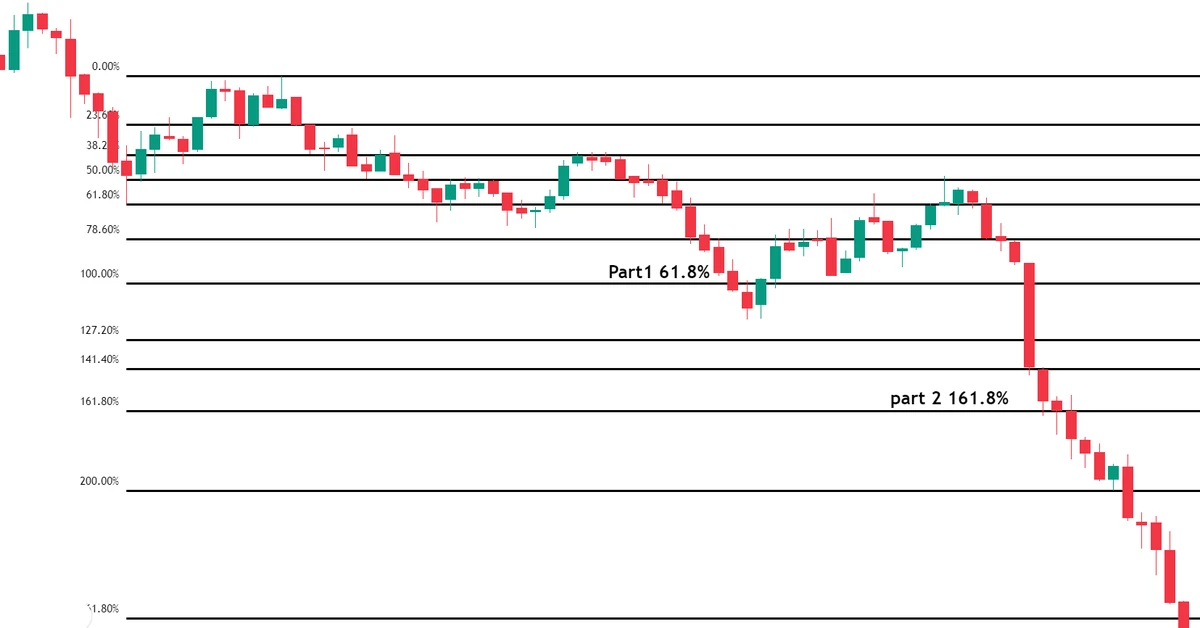
Practical Example: Trading Gold with Fibonacci Retracements
Suppose gold moves from 1500 to 1800 and then pulls back. Plot the retracement from the 1500 low to the 1800 high. The 50 percent level is located near 1650, and the 61.8 percent level is situated near 1626. If the price stalls at the 50 percent zone and forms a bullish engulfing candle with rising volume, you can enter a long position. Place a stop below the 61.8 level to limit risk and size the position accordingly.
A plan exists at the prior high near 1800 or at the 127 extension if the price breaks above resistance. If the RSI shows positive divergence while the price tests the retracement, then you add confirmation to hold the trade for a more extended period.
Common Mistakes Traders Make with Fibonacci and How to Fix Them
Relying on a single level as a magic entry point creates false signals. Treat levels as zones and require confirmation. Drawing from the wrong swing points or using too small a time frame produces noise. Use clear, recent structural highs and lows on a higher time frame.
Over-risking or ignoring position sizing can destroy profit, even when entries are correct. Set a fixed risk per trade and size positions to match. Finally, avoid chasing prices beyond key levels without fresh confirmation.
Quick Checklist
- Have you confirmed the trend on a higher time frame?
- Did you draw Fibonacci from the correct swing points?
- Is there a candlestick or momentum confirmation at the retracement zone?
- Is your stop placed beyond the next structural level and sized to your risk rules?
- Do profit targets align with prior highs or extension levels?
How to Combine Fibonacci With Other Tools

Using Japanese Candlestick Patterns with Fibonacci
Draw a Fibonacci retracement from the swing low to swing high in an uptrend or the reverse in a downtrend. Watch where standard retracement ratios 23.6, 38.2, 50, 61.8, and 78.6 line up with clear candlestick signals. A hammer at 61.8, following a pullback, indicates that buyers are stepping in.
A bearish engulfing pattern near 38.2 on a corrective bounce signals that sellers are regaining control. A Doji at 50 suggests indecision and a probable pause. How do you act on those signals? Wait for the candle to close, then use the next candle for entry confirmation. Place your stop below the recent swing low for a long position or above the swing high for a short position, and size the position to the stop distance.
Combining Fibonacci with Oscillators and Indicators
Apply MACD, RSI, or Stochastic as secondary confirmation when the price hits a Fibonacci retracement zone. Look for bullish MACD crossovers or rising histograms near a support retracement, and look for bearish crossovers near resistance retracements.
Watch RSI for oversold readings under 30 at support zones or overbought readings above 70 at resistance. Look for hidden or regular divergence between price and RSI or MACD to spot weakening moves before a reversal. Combine oscillator signals with the candlestick pattern and the level before committing capital.
Moving Averages, Trendlines, and Pivot Points
Add simple moving averages or exponential moving averages, such as the 20, 50, and 200-day, to the chart when a Fibonacci level lines up with an EMA, a horizontal support or resistance, a pivot point, or a drawn trendline, creating a confluence zone with higher statistical value. Use Confluence to tighten stops and increase confidence in entries. Volume spikes at a confluence zone add another layer of confirmation because they show participation.
Fibonacci Extensions and Targets
Use Fibonacci extension levels 127.2, 161.8, and 261.8 to set profit targets after an entry off a retracement. Measure from the same swing points used for the retracement and mark the extension levels ahead as logical exits. Combine extensions with prior structure or moving averages that sit near the same extension level to pick higher probability targets. Consider partial profit taking at the first extension and trailing the rest with a moving average or the last swing low.
Practical Entry Rules, Stop Placement, and Position Sizing
- Identify the trend on a higher timeframe.
- Draw retracement on the primary swing.
- Wait for the price to reach a key Fibonacci ratio that also shows a candlestick signal.
- Confirm with an oscillator or volume.
- Enter on confirmation candle close or on a breakout of that candle high for longs or low for shorts.
Place stop loss beyond the next swing extreme or a few pips beyond the Fibonacci level to avoid noise. Size positions so risk per trade stays around one percent or whatever your plan allows. Which timeframe do you want to use for entries, and which for trend direction?
Common Mistakes and Quick Rules to Avoid
Avoid redrawing Fibonacci constantly. Choose clear swing highs and lows on a timeframe that matches your trading horizon. Do not take trades purely on a Fibonacci level without candlestick or momentum confirmation. Do not widen or tighten stops to force a fixed risk percentage after entry; set your risk first, then select your size. Do not trade small, noisy candles at major news without confirmation from indicators and volume.
Related Reading
- Forex Trading Candlestick Patterns
- Forex Trading Algorithms
- Risk Management In Forex Trading
- Forex Trading Day
- Minor Forex Pairs
- Forex Trading Vs Crypto Trading
- Advanced Forex Trading
- Copy Forex Trading
- Best Books On Forex Trading
- Best EA For Forex Trading
Benefits of Using Fibonacci in Forex Trading

Pinpoint Market Turning Points with Fibonacci Support and Resistance
Fibonacci retracement and extension tools translate a clear swing high and swing low into measurable support and resistance zones. Traders mark significant trend moves and plot ratios such as 23.6, 38.2, 50, 61.8, and 78.6 percent to identify potential price pauses or reversals. Use these levels to observe price action around the 61.8 area for shallow retracements or the 50 and 38.2 zones for shallower pullbacks, and note how candlestick patterns form at these points.
Pair Fibonacci with Other Technical Indicators for Cleaner Entry and Exit Signals
Why rely on one signal when you can look for confluence? Combine Fibonacci levels with momentum indicators like MACD or the Stochastic oscillator, and with simple moving averages to confirm trend direction. For example, a buy setup gains strength when the price hits the 50 percent retracement, the MACD shows a bullish crossover, and a 50-period moving average lies below the price; this stacking of signals refines entries and reduces the likelihood of false breaks.
One Set of Tools for Any Market and Any Timeframe
Fibonacci techniques apply to forex pairs, equities, commodities, and cryptocurrencies because price movements often occur in waves that traders can accurately measure. Apply retracements on a one-minute chart for scalps or on weekly charts for swing positions; the same 38.2 and 61.8 rules still apply. Use the tool across timeframes to check higher timeframe resistance or support before taking a lower timeframe entry.
Use Fibonacci for Risk Management
You can place stop-loss orders just beyond a Fibonacci level and set take-profit orders at extension targets, such as 127.2, 161.8, or 261.8 percent. That gives straightforward risk-to-reward math and helps you size a position based on distance to the stop and the extension target. For example, buying near the 61.8 retracement with a stop below the 78.6 area and a first target at 127.2 creates a logical trade plan.
How Collective Use Makes Fibonacci Self-Reinforcing
Many traders and automated systems watch the same Fibonacci ratios, so orders often cluster around common retracement and extension points. That clustering can turn a drawn line into an active support or resistance, because stops and entries concentrate where many expect a reaction. Watch volume and order flow around those zones to see whether the market respects the level or sweeps through it.
Fast to Learn, Useful at Advanced Levels
Fibonacci math is simple to grasp, and the drawing rules are straightforward, making it accessible to new traders. Advanced traders layer Fibonacci with trend lines, Elliott Wave counts, harmonic patterns, and order block analysis to increase precision. Want a practical tip? Practice marking swing highs and lows on demo charts and note how the price reacts at 38.2 to 61.8 levels before applying real capital.
Related Reading
- Forex Options Trading Strategy
- Best Laptop For Trading Forex
- Forex Trading Course For Beginners
- Forex Trading App For Beginners
- How To Choose The Best Forex Broker
- Best Forex Pairs To Trade During New York Session
- Forex Trading Strategies For Beginners
- Forex Algorithmic Trading Strategies
- Best Forex Pairs For Beginners
Cons of Fibonacci Trading

Subjectivity and Inconsistency
Traders pick different swing highs and swing lows when they draw Fibonacci retracement and extension lines, so two charts of the same forex pair can show different 38.2, 50, and 61.8 zones. The timeframe choice also changes the picture; a daily chart provides various support and resistance zones than a 15-minute chart. That inconsistency affects entry, stop-loss, and take-profit placement, making signals unreliable without clear rules. Which swing points do you trust on your charts?
Fibonacci Relies on Historical Data
Fibonacci tools map historical price movements into potential support zones and resistance zones, but they do not account for new news, central bank actions, or sudden shifts in order flow. When an economic release or geopolitical event occurs, the price can surge through a golden ratio level, creating false breakouts or significant gaps. Relying solely on past patterns leaves you vulnerable to unexpected volatility and execution issues, such as slippage. How will your process handle an unexpected news shock?
Not a Solo Strategy
Fibonacci levels lack standalone predictive power. Traders must combine retracement and extension analysis with trend analysis, market structure, moving averages, volume, momentum indicators, and clear price action setups to achieve higher-probability entries. Without that confluence, a pullback to 61.8 can be noise rather than a tradeable support zone, and stop losses placed at a Fibonacci level offer no guarantee of protection. What other signals do you pair with your Fibonacci levels?
Market Noise and Overcrowding Effects
Because Fibonacci ratios are popular across forex and stock traders, common retracement and extension points can become crowded liquidity areas. That crowding can cause stop hunts, fakeouts, and choppy price action where many orders cluster around the same support or resistance zone. Overcrowded zones make order execution and risk management more challenging and can distort how the price reacts to a particular level. Do you identify crowded zones before you enter a trade?
Complexity and Learning Curve
Fibonacci offers retracements, extensions, fans, arcs, time zones, and more. Each tool has a distinct plotting method and interpretation, and beginners often confuse them or apply the wrong set of ratios. Misplaced Fibonacci drawing points lead to incorrect targets and errant entries, and that learning curve can encourage overtrading or paralysis. Have you practiced placing levels across multiple timeframes and market conditions?
Limitations in Fast Markets
Fixed Fibonacci ratios assume price respects natural retracements, but in fast-moving markets, price can skip or pierce those levels in seconds. Flash moves, gaps, and news-driven rallies produce slippage and whipsaws that make rigid Fibonacci targets useless. Traders need dynamic trade management, wider stops, or alternative entries when volatility spikes to avoid being stopped out by rapid price movements. Can your trade plan adapt to a sudden gap or a flash crash?
Get 25-30% off Today - Sign up to Get Access to Up to $800K Today

Goat Funded Trader gives you access to simulated accounts up to $800K with the most trader-friendly conditions in the industry. There are no minimum targets, no time limits, and triple paydays with up to 100% profit split.
Join over 98,000 traders who have already collected more than $9.1 million in rewards, all backed by our 2-day payment guarantee with a $500 penalty for delays.
Choose your path to funding through customizable challenges or start trading immediately with our instant funding options. Sign up to get access to up to $800K today and 25 to 30 percent off.
How to Use Funding Programs to Reduce Difficulty
Funding programs remove one significant barrier: capital. With a simulated funded account, you can trade with real rules and manage risk under market conditions without depleting personal capital. Utilize these accounts to test Fibonacci-based entries, refine stop placement, and demonstrate consistency across various timeframes.
Before trading with a funded account, simulate the exact rules, including risk limits, allowed instruments, and payout structure. Treat the program like an employer that pays you only when you meet the criteria, and build a routine that produces repeatable results.
Questions That Make Your Practice Efficient
- Which Fibonacci retracement level do you use most and why?
- Do you confirm that the level is based on momentum or volume?
- How do you size positions when a trade hits a confluence of indicators?
Answering these keeps the study specific and actionable.
Be Great and get the App


.webp)


