


Best Day Trading Indicators
Explore the most widely used day trading indicators, what each one measures and how experienced traders apply them to make informed trade decisions.

You watch the ticker as prices spike and reverse, and you wonder which signals deserve your trust. Day Trading Tips often point to indicators such as moving averages, RSI, MACD, Bollinger Bands, volume, trend lines, and support and resistance; however, the flood of signals makes quick decisions difficult. This guide breaks down the key day trading indicators, explains how oscillators, momentum, and volatility work with price action, and gives clear entry and exit rules so you can make smarter trades with confidence.
To put those indicator rules into practice, Goat Funded Trader offers a prop firm that backs traders with funded accounts, clear risk rules, and a testing ground, allowing you to build your skills and trade larger sizes without risking your own capital.
9 Day Trading Indicators You Should Know

1. Bollinger Bands
Bollinger Bands are a set of overlays used in technical analysis, constructed mathematically from the standard deviations of prices away from their simple moving average (SMA). The SMA is the average price over a defined period, such as 20, 50, or 100 days. The upper band is the moving average plus a set number of standard deviations, and the lower band is the moving average minus the same number of standard deviations.
For example, suppose a trader uses a 50-day moving average and two standard deviations. In that case, the upper band equals the 50-day SMA plus two times the standard deviation, while the lower band equals the 50-day SMA minus two times the standard deviation.
Bollinger Bands adapt dynamically to market volatility. When the bands contract (narrow), it signals low volatility, sometimes called a "squeeze," suggesting a potential upcoming price breakout or change in trend. Conversely, when the bands expand (widen), it signals high volatility, often indicating that a strong price trend is underway or about to come to an end.
How to Use Bollinger Bands
- Overbought and Oversold Levels: Prices hugging the upper band suggest an overbought condition, while prices hugging the lower band indicate oversold conditions relative to the average price.
- Volatility Measurement: A squeeze (narrow bands) implies low volatility and a possible imminent breakout. Wide bands indicate high volatility.
- Breakout Signals: When price moves decisively outside the bands, it signals a breakout, which may precede a significant price movement.
- Swing Trading: Prices often oscillate between the bands. Traders may buy after the price bounces from the lower band and gradually sell near the upper band, or short-sell in the opposite manner.
2. Moving Average Convergence Divergence (MACD)
The Moving Average Convergence Divergence (MACD) is a widely used technical momentum indicator that traders use to gauge the strength, direction, and duration of a price trend in a market. It was developed in the late 1970s and builds on the relationship between two exponential moving averages (EMAs) of a security's price, typically the 12-day EMA and the 26-day EMA.
The MACD Consists of Three Components
- MACD line: Calculated by subtracting the 26-period EMA from the 12-period EMA. This line oscillates above and below zero, reflecting shifts in momentum.
- Signal line: A 9-day EMA of the MACD line itself, which acts as a trigger for buy or sell signals.
- Histogram: Represents the difference between the MACD line and the signal line, visualized as bars oscillating above and below a zero line.
How to Use MACD
- Trend Identification: When the MACD line crosses above zero, it signals an upward trend (bullish market); crossing below zero signals a downward trend (bearish market).
- MACD Crossovers: A bullish signal occurs when the MACD line crosses above the signal line, indicating a potential buy. Conversely, a bearish signal occurs when the MACD line crosses below the signal line, indicating a potential sell.
- Momentum Measurement: The MACD histogram shows momentum strength. A positive histogram suggests increasing uptrend momentum; a negative histogram signals growing downtrend momentum.
- Price Reversals: Divergences between MACD and price trends (e.g., price making new highs while MACD does not) can signal potential reversals.
3. Relative Strength Index (RSI)
The Relative Strength Index, commonly known as RSI, is a momentum oscillator that measures both the magnitude and speed of recent price changes to assess overbought or oversold conditions of a security. Developed by J. Welles Wilder Jr., it is calculated over a typical 14-day period and fluctuates on a scale from 0 to 100.
RSI compares the average gains to the average losses over the look-back period. A reading above 70 traditionally signals that the stock is potentially overbought, meaning the price may have risen too quickly and could be due for a pullback. Conversely, an RSI below 30 suggests that the asset may be oversold and undervalued, signaling a potential price bounce. The RSI can also reveal trends, with readings generally remaining between 40 and 90 in an uptrend and 10 and 60 in a downtrend.
How to Use RSI
- Overbought/Oversold Conditions: Traders interpret RSI values above 70 as overbought and below 30 as oversold, although these thresholds can be adjusted to 80/20 for stronger confirmation.
- Trend Confirmation: The RSI remaining mainly in the upper range indicates bullish momentum, while a predominance in the lower range signals bearish pressure.
- Divergences: When price trends and RSI move in opposite directions, it may indicate a pending reversal.
- Chart Patterns: RSI can form chart patterns such as double tops and bottoms, which may not be visible on price charts and can signal potential entry or exit points.
4. Stochastic Oscillator
The Stochastic Oscillator is a momentum indicator that compares a security's closing price to its price range over a specified period, typically 14 periods. Developed by George Lane in the 1950s, it measures the proximity of a price to its recent high or low within a specified timeframe. It oscillates between 0 and 100, providing signals about overbought and oversold conditions. Readings above 80 indicate that the security may be overbought (potential for price pullback), while readings below 20 suggest it may be oversold (potential for price rebound).
This indicator consists of two lines: %K, which represents the current value, and %D, which is the moving average of %K and acts as a signal line. The crossing of these lines can be interpreted as buy or sell signals. For example, when %K crosses above %D in oversold territory, it can be a buying opportunity, and when %K crosses below %D in overbought territory, it can suggest selling.
How to Use the Stochastic Oscillator
- Identify Overbought/Oversold: Use readings above 80 to signal overbought conditions and below 20 for oversold conditions.
- Crossovers: Look for %K and %D line crossovers. Bullish crossovers (%K crosses above %D) in oversold zones can indicate buy signals; bearish crossovers in overbought zones can suggest sell signals.
- Divergences: When price movement and the oscillator diverge (e.g., price makes a new high but oscillator does not), it may indicate a potential trend reversal.
Combine with Trends: Use the stochastic oscillator in conjunction with trend direction and other indicators to filter false signals, as it tends to be more effective in range-bound markets.
5. Average Directional Index (ADX)
The Average Directional Index (ADX) is a trend strength indicator that measures the momentum or strength of a trend, but not its direction. It is derived from the Directional Movement System developed by J. Welles Wilder. The ADX ranges from 0 to 100, where higher values indicate a strong trend and lower values indicate a weak or non-existent trend.
The indicator is composed of three lines: the ADX itself (a smoothed moving average of the difference between +DI and -DI), the positive directional indicator (+DI), and the negative directional indicator (-DI). The +DI line measures upward movement pressure, while -DI measures downward movement pressure. Together, these lines help to identify whether the market is trending and the strength of that trend.
How to Use ADX
- Trend Strength: ADX values above 25 generally indicate a strong trend, while values below 20 suggest a weak or no trend.
- Trend Direction: When +DI is above -DI, the trend is upward; when -DI is above +DI, the trend is downward.
- Momentum: Rising ADX signals increasing momentum, while a falling ADX suggests weakening momentum.
- Avoid Choppy Markets: Traders often avoid trading when ADX is below 20 because signals in weak or sideways markets can be unreliable.
6. Commodity Channel Index (CCI)
The Commodity Channel Index (CCI) is a momentum oscillator initially developed to identify cyclical turns in commodity prices but now widely used across various markets, including stocks and forex. It measures the current price level relative to its average price over a specified period, usually 14 or 20 periods. The CCI oscillates around zero, with readings above +100 and below -100 commonly used to identify overbought or oversold conditions.
A high positive CCI value indicates that the price is significantly above its average, signaling strong upward momentum. In contrast, a low negative value suggests the cost is far below its average, indicating strong downward momentum.
How to Use CCI
- Overbought/Oversold: CCI values above +100 indicate an overbought condition, suggesting a buy signal, while values below -100 indicate oversold conditions signaling a potential sell.
- Trend Signals: When the CCI moves above +100, it signals the beginning of a strong uptrend, whereas a move below -100 signals a strong downtrend.
- Divergence: Like other oscillators, divergence between price action and CCI can predict potential trend reversals.
- Adjustable Thresholds: For highly volatile assets, traders can adjust the overbought and oversold levels to +150/-150 or +200/-200 to reduce false signals.
7. Momentum Oscillator
The Momentum Oscillator is a technical indicator that measures the rate of change in a security's price over a specific period. Unlike many oscillators, it does not have fixed upper or lower bounds. It is calculated by dividing the current price by the price n periods ago and multiplying by 100. This oscillator helps traders identify the strength and velocity of a price trend.
Values above 100 indicate upward momentum, while values below 100 indicate downward momentum. Because this indicator lacks fixed boundaries, traders typically identify custom support and resistance levels based on historical data for each security to interpret momentum extremes.
How to Use the Momentum Oscillator
- Trend Continuation: When the oscillator moves above historically established upper boundaries during an uptrend, it suggests the trend is strong and likely to continue.
- Downtrend Confirmation: A drop below the lower boundary during a downtrend signals momentum favoring continuation of the decline.
- Divergence: Price action diverging from momentum signals (e.g., price making new highs while oscillator fails to do so) can suggest imminent reversals.
- Complementing Other Tools: Since it does not provide fixed extreme levels, traders often use it in conjunction with support/resistance levels or other indicators for improved decision-making.
8. On-Balance Volume (OBV)
On-Balance Volume (OBV) is a momentum indicator that combines price and volume data to help predict future price movements based on volume flow. Joseph Granville developed it in the early 1960s. OBV adds volume on days when the price closes higher than the previous day and subtracts volume when the price closes lower. If the closing price is unchanged, the OBV remains the same. This creates a cumulative volume line that reflects buying and selling pressure.
The theory behind OBV is that volume precedes price. When the OBV line rises, it indicates intense buying pressure pushing the price up, and when the OBV falls, it reflects selling pressure. Divergences between OBV and price can signal upcoming reversals.
How to Use On-Balance Volume
- Trend Confirmation: If both price and OBV form higher highs and higher lows, the uptrend is likely to be strong. Similarly, if both show lower highs and lower lows, the downtrend is expected to be robust.
- Divergence: When price makes new highs but OBV fails to reach new highs, it may indicate a weakening trend and potential reversal. The same applies when price makes new lows but OBV does not.
- Accumulation/Distribution: OBV rising while price remains flat suggests accumulation (buying interest), while a falling OBV on flat price indicates distribution (selling pressure).
- Volume Support: Strong trends supported by corresponding OBV movement are more reliable as volume validates the price action.
9. Accumulation/Distribution Line (A/D Line)
The Accumulation/Distribution Line, often abbreviated as ADL, is a volume-based technical indicator that measures the flow of money into and out of a security by combining price and volume data. Marc Chaikin developed it and aims to assess whether traders are accumulating (buying) or distributing (selling) the security.
The ADL calculates money flow volume by considering the position of the closing price relative to the period's high-low range, weighted by volume. It helps highlight buying or selling pressure that may confirm trends or indicate potential reversals.
How to Use the Accumulation/Distribution Line
- Trend Confirmation: If price and ADL both form higher highs and higher lows, it confirms a strong uptrend. Conversely, if both form lower highs and lower lows, a downtrend is confirmed.
- Divergence Signals: When the price continues upward but the ADL fails to make a new high (negative divergence), it may suggest that the uptrend is weakening and a reversal could be forthcoming. Likewise, if price falls but ADL does not confirm lower lows (positive divergence), a downtrend may be losing momentum.
- Accumulation and Distribution: A rising ADL during a sideways price range indicates accumulation, often preceding a breakout to the upside. Falling ADL during sideways price action signals distribution, which tends to precede downward moves.
- Combined Use: Since ADL alone may generate minor false signals, it is often paired with other indicators such as RSI or moving averages to increase reliability. Which combination of ADL and an oscillator will sharpen your entries?
Related Reading
- Can You Make Money Day Trading
- How Old Do You Have to Be to Day Trade
- Options Trading vs Day Trading
- Day Trading Success Stories
- Day Trading Crypto vs Stocks
- Day Trading Psychology
- Day Trading as a Side Hustle
- Why is Day Trading Restricted
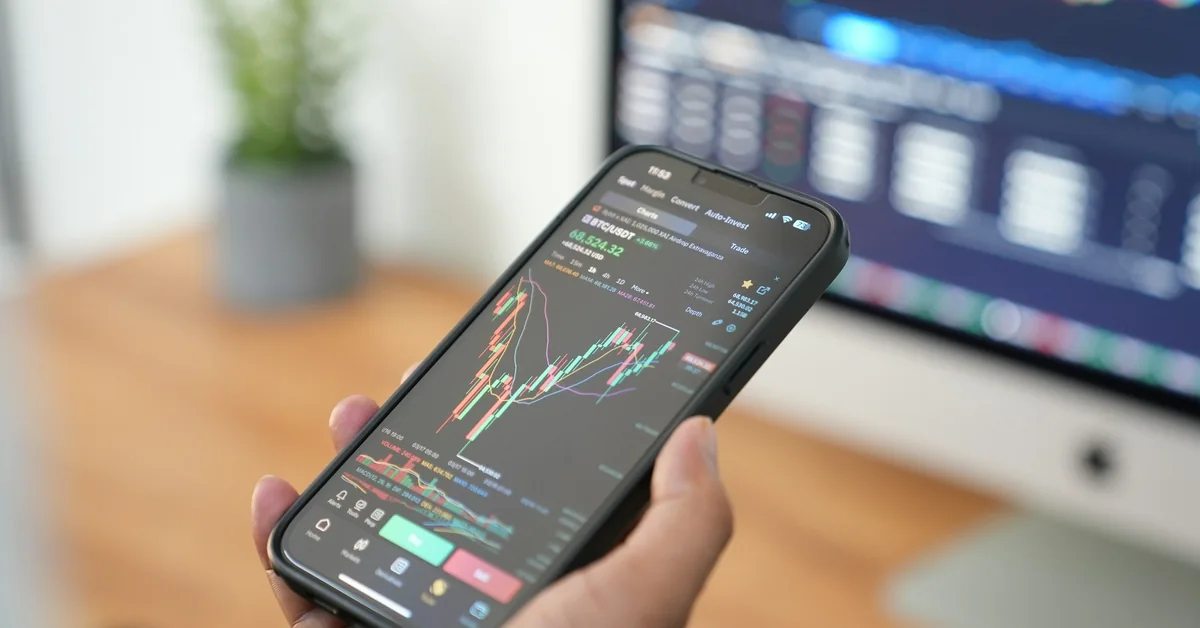
What are Day Trading Indicators?
.jpeg)
Day trading indicators are specialized mathematical tools used by traders to quickly analyze price movements and market trends. Their primary purpose is to help day traders make informed decisions about when to enter or exit a trade during the fast-paced intraday market sessions. These indicators simplify complex price data into visual signals and patterns, enabling traders to forecast potential price directions without relying on fundamental business data, such as earnings or revenue.
There are two broad types of day trading indicators, including overlays and oscillators. Overlays are drawn directly on price charts and include tools like Moving Averages and Bollinger Bands, which highlight trends and volatility. Oscillators, such as the Relative Strength Index (RSI) and the Moving Average Convergence/Divergence (MACD), move within a fixed range and measure momentum and potential reversal points. Using these indicators together enables traders to more accurately gauge market direction, strength, and possible turning points, thereby reducing the risk associated with relying on a single signal.
Popular day trading indicators include Moving Averages (which smooth price data to reveal trends), RSI (indicating overbought or oversold conditions), Bollinger Bands (measuring volatility and potential breakout zones), and Volume Indicators (which confirm the strength of price moves). Another critical tool is the Average Directional Index (ADX), which measures the strength of a trend irrespective of its direction, helping traders decide whether to follow a trend or prepare for a range-bound market.
Day traders often combine multiple indicators to form a cohesive trading strategy. This integrated approach enables them to identify entry and exit points with greater confidence, manage risks effectively, and adjust their tactics to changing market conditions. Since day trading requires quick and precise decisions, mastering these indicators with real-time data practice is essential for success.
Among day traders, the importance of an efficient and reliable indicator setup cannot be overstated. Many professional traders emphasize honing one's skill in interpreting these technical analysis tools rather than seeking a single "best" indicator. Successful trading hinges on sound analysis, discipline, and a clear plan. It's common advice from experienced traders to update and refine trading strategies continuously based on indicator feedback and market dynamics.
When to prefer price action over indicators
Price action such as breakouts, pullbacks to trendlines, or supply and demand zones often outperforms indicator-based entries in thin markets. Ask yourself which gives a clearer edge in the current session, the indicator signal or raw price behavior, and act on the stronger cue.
For traders seeking a structured learning path, expert guidance, and funded opportunities for day trading, prop firms like Goat Funded Trader offer tailored programs designed to teach practical skills in real market environments.
Traded with discipline, a funded account can accelerate growth and limit personal capital at risk. As a prop firm, Goat Funded Trader gives you access to simulated accounts up to $800K with the most trader-friendly conditions in the industry, no minimum targets, no time limits, and triple paydays with up to 100% profit split. Join over 98,000 traders who've already collected more than $9.1 million in rewards, backed by our 2-day payment guarantee with a $500 penalty for delays; choose customizable challenges or instant funding and sign up now to Get Access to up to $800 today with 25 to 30 percent off.
Why You Need Technical Indicators for Day Trading
.jpeg)
Read Market Motion
Technical indicators provide a structured way to determine whether the price is trending up, trending down, or stuck in a range. Use moving averages and trend lines to map direction, and watch higher timeframe structure to avoid noise on the one-minute chart. When price respects support and resistance or prints pattern after pattern, indicators like trend lines, moving average crossovers, and simple chart patterns confirm what you see on the candles. Which trend are you trading right now?
Precision Entries and Exits
Oscillators such as RSI, stochastic, and MACD show momentum shifts and overbought or oversold conditions that often precede bigger moves. Combine an oscillator with an overlay like a moving average or Bollinger Bands, and add candlestick patterns or Fibonacci retracement levels for entry and exit confirmation. That way, you do not guess where to place entries or exits but follow a repeatable signal that improves risk-to-reward. Do you wait for confirmation or trade the first momentum burst
Protect Your Capital
Stop-loss placement and position sizing become smarter when you utilize volatility tools like ATR and Bollinger Bands, along with support and resistance levels, and volume indicators. Set trailing stops that follow ATR or moving averages to lock gains while letting winners run. Calculate risk per trade with position sizing rules tied to ATR and a fixed percent of capital, and log each trade for backtesting. What stop level will you set on your next position?
Focus on Meaningful Moves
Short term charts carry a lot of random ticks. Smooth price with moving averages, use longer timeframe trend confirmation, and filter false breakouts with volume indicators or a second confirming oscillator. Bollinger Bands and ADX help you see when volatility is expanding versus when price is just wobbling. Do you want to trade every tick or only confirmed movement?
Combine Indicators for Stronger Signals
No single indicator gives a complete answer. Pair overlays, such as exponential moving averages, with oscillators like RSI or MACD, and add volume confirmation and a volatility measure like ATR. Then, backtest the rules. Avoid redundant tools that all measure the same thing. Define entry rules, exit rules, and a trade management plan that uses signal confirmation from at least two independent indicators. Which indicator combo fits your edge
Indicators Keep You Disciplined
Indicators turn subjective judgment into objective signals. With preset rules for entries, stop loss, trailing stop, and position sizing, you reduce emotional mistakes when markets move fast. Keep a trading journal, review trades against signals, and refine rules through backtesting so discipline becomes part of the system rather than a daily struggle. Can you trust your rules over your instincts?
Related Reading
- How Much Can You Make Day Trading With $1,000
- Day Trading Indices
- What is Liquidity in Day Trading
- Can You Start Day Trading With $100
- Day Trading as a Career
- Why is Pattern Day Trading Illegal
- Are Day Trading Courses Worth It
- Best Brokerage for Day Trading
- Best Cryptos for Day Trading
- What is Day Trading Buying Power
- Best Time Frame for Day Trading
How to Use Technical Indicators in Day Trading
.jpeg)
Pairing Indicators
Use at least two types of indicators before risking capital. Pair a trend filter like a 50-period moving average or VWAP with a momentum oscillator such as RSI or the MACD histogram to spot whether a move has followed through. Add a volume measure, such as on balance volume or simple volume spikes, to confirm that the market agrees with the price. For example, a breakout above resistance that occurs with a rising OBV and a MACD bullish crossover provides a stronger entry signal than any one of those factors alone. How often do you check the volume as confirmation before taking a trade?
Leveraging a Comprehensive Range of Tools
Keep a concise set of complementary tools. Use both short and long moving averages to define the trend and identify dynamic support. Use RSI or stochastic to find overbought and oversold momentum. Utilize Bollinger Bands to gauge volatility and identify potential squeeze breakouts. Keep VWAP and volume profile for intraday value and institutional flow.
Use ATR for position sizing and setting stop loss levels. Use pivot points and Fibonacci retracement for likely intraday support and resistance. Use candlestick patterns and simple trendlines to read price structure. Each item gives a different view: trend, momentum, volatility, volume, structure, and timing.
Building and Following a Trading Strategy
Write concrete entry, exit, and risk rules tied to indicator signals. Example trend following rule: only trade long when price sits above the 50 EMA on the 30-minute chart, enter on a pullback to the 20 EMA confirmed by RSI crossing above 40, place a stop loss one ATR below the pullback low, set a take profit at the next pivot point, or use a 2 to 1 reward-to-risk ratio.
For a breakout rule: require a breakout candle above resistance, a volume spike above the 20-period average, and an intraday close above VWAP before entering. Backtest the trading strategy over recent data and then forward test on a small sample size. Track expectancy, win rate, and max drawdown so you can judge whether the rule deserves scaling
Focusing on Appropriate Time Frames
Match indicator settings to the time frame you trade. Day traders often use 5-minute to 1-hour charts for entries and exits while using a higher timeframe, such as 4 hours, to define the primary trend. Use longer moving averages on higher timeframes as a trend filter and shorter EMAs on lower timeframes for entry timing. Keep indicator periods proportional when you move between timeframes, so an EMA that works on 1-hour charts is not blindly applied to a 5-minute chart. How do you align your higher-timeframe trend with your lower-timeframe entry signals?
Regularly Updating Your Trading Plan
Adjust settings when market behavior changes, but avoid overfitting to ensure optimal performance. Test any change across multiple market sessions and run walk-forward checks rather than optimizing to a single past data run. When volatility rises, consider widening ATR stops or widening Bollinger Band multipliers. When volume profiles shift, revalidate your VWAP bias. Log every change in a trading journal with the reason, the test period, and the outcome metrics so you can reverse changes that worsen expectancy. When did you last run a controlled test on a setting you use today?
Get 25-30% off Today - Sign up to Get Access to up to $800 today.
Goat Funded Trader gives you access to simulated accounts up to $800K with the most trader-friendly conditions in the industry - no minimum targets, no time limits, and triple paydays with up to 100% profit split. Join over 98,000 traders who've already collected more than $9.1 million in rewards, all backed by our 2-day payment guarantee with $500 penalty for delays. Choose your path to funding through customizable challenges or start trading immediately with our instant funding options. Sign up to Get Access to up to $800 today, and 25 to 30% off.
How the Funding Paths Work and Which Fits Your Style
Pick a customizable challenge if you want to practice risk rules, target selection, and trade management before scaling. Choose instant funding when you want to trade live and receive real profit splits right away. Each path sets rules for position sizing, max drawdown, and profit withdrawal frequency. Which one suits your psychology and time frame depends on whether you trade breakouts, scalps, or trend following systems.
Trader Friendly Rules that Matter on the Desk
No minimum targets and no time limits remove arbitrary pressure that causes poor entries. Triple paydays and up to 100% profit split let you compound gains and reclaim the edge with simple math. The 2-day payment guarantee and $500 penalty for delays force accountability and fast payouts. Those features build operational trust and let you focus on price action, risk per trade, and order execution.
How to Start Today with Goat Funded Trader and Indicator Practice
Open a simulated account to practice indicator settings, order types, and execution without real capital risk. Use instant funding when your system shows a stable edge under funded rules. Apply the discount offer when signing up to reduce the challenge cost and accelerate access to larger account sizes.
Related Reading
- Best Rsi Settings for Day Trading
- Best Moving Average for Day Trading
- Day Trading Checklist
- Day Trading Technical Analysis
- Best Markets for Day Trading
- Stocks for Day Trading
- Day Trading Books
- Best Tools for Day Trading
- Day Trading Rules
- Day Trader Salary
- Best Day Trading Stocks
- How to Day Trade for a Living
- Day Trading Patterns
- Best Stocks to Day Trade
- Is Day Trading Legal
Be Great and get the App


.webp)


