


Day Trading Patterns Guide
Explore the most reliable chart patterns day traders use to spot high-probability entries, time exits and maintain a consistent edge in any market.

.png)
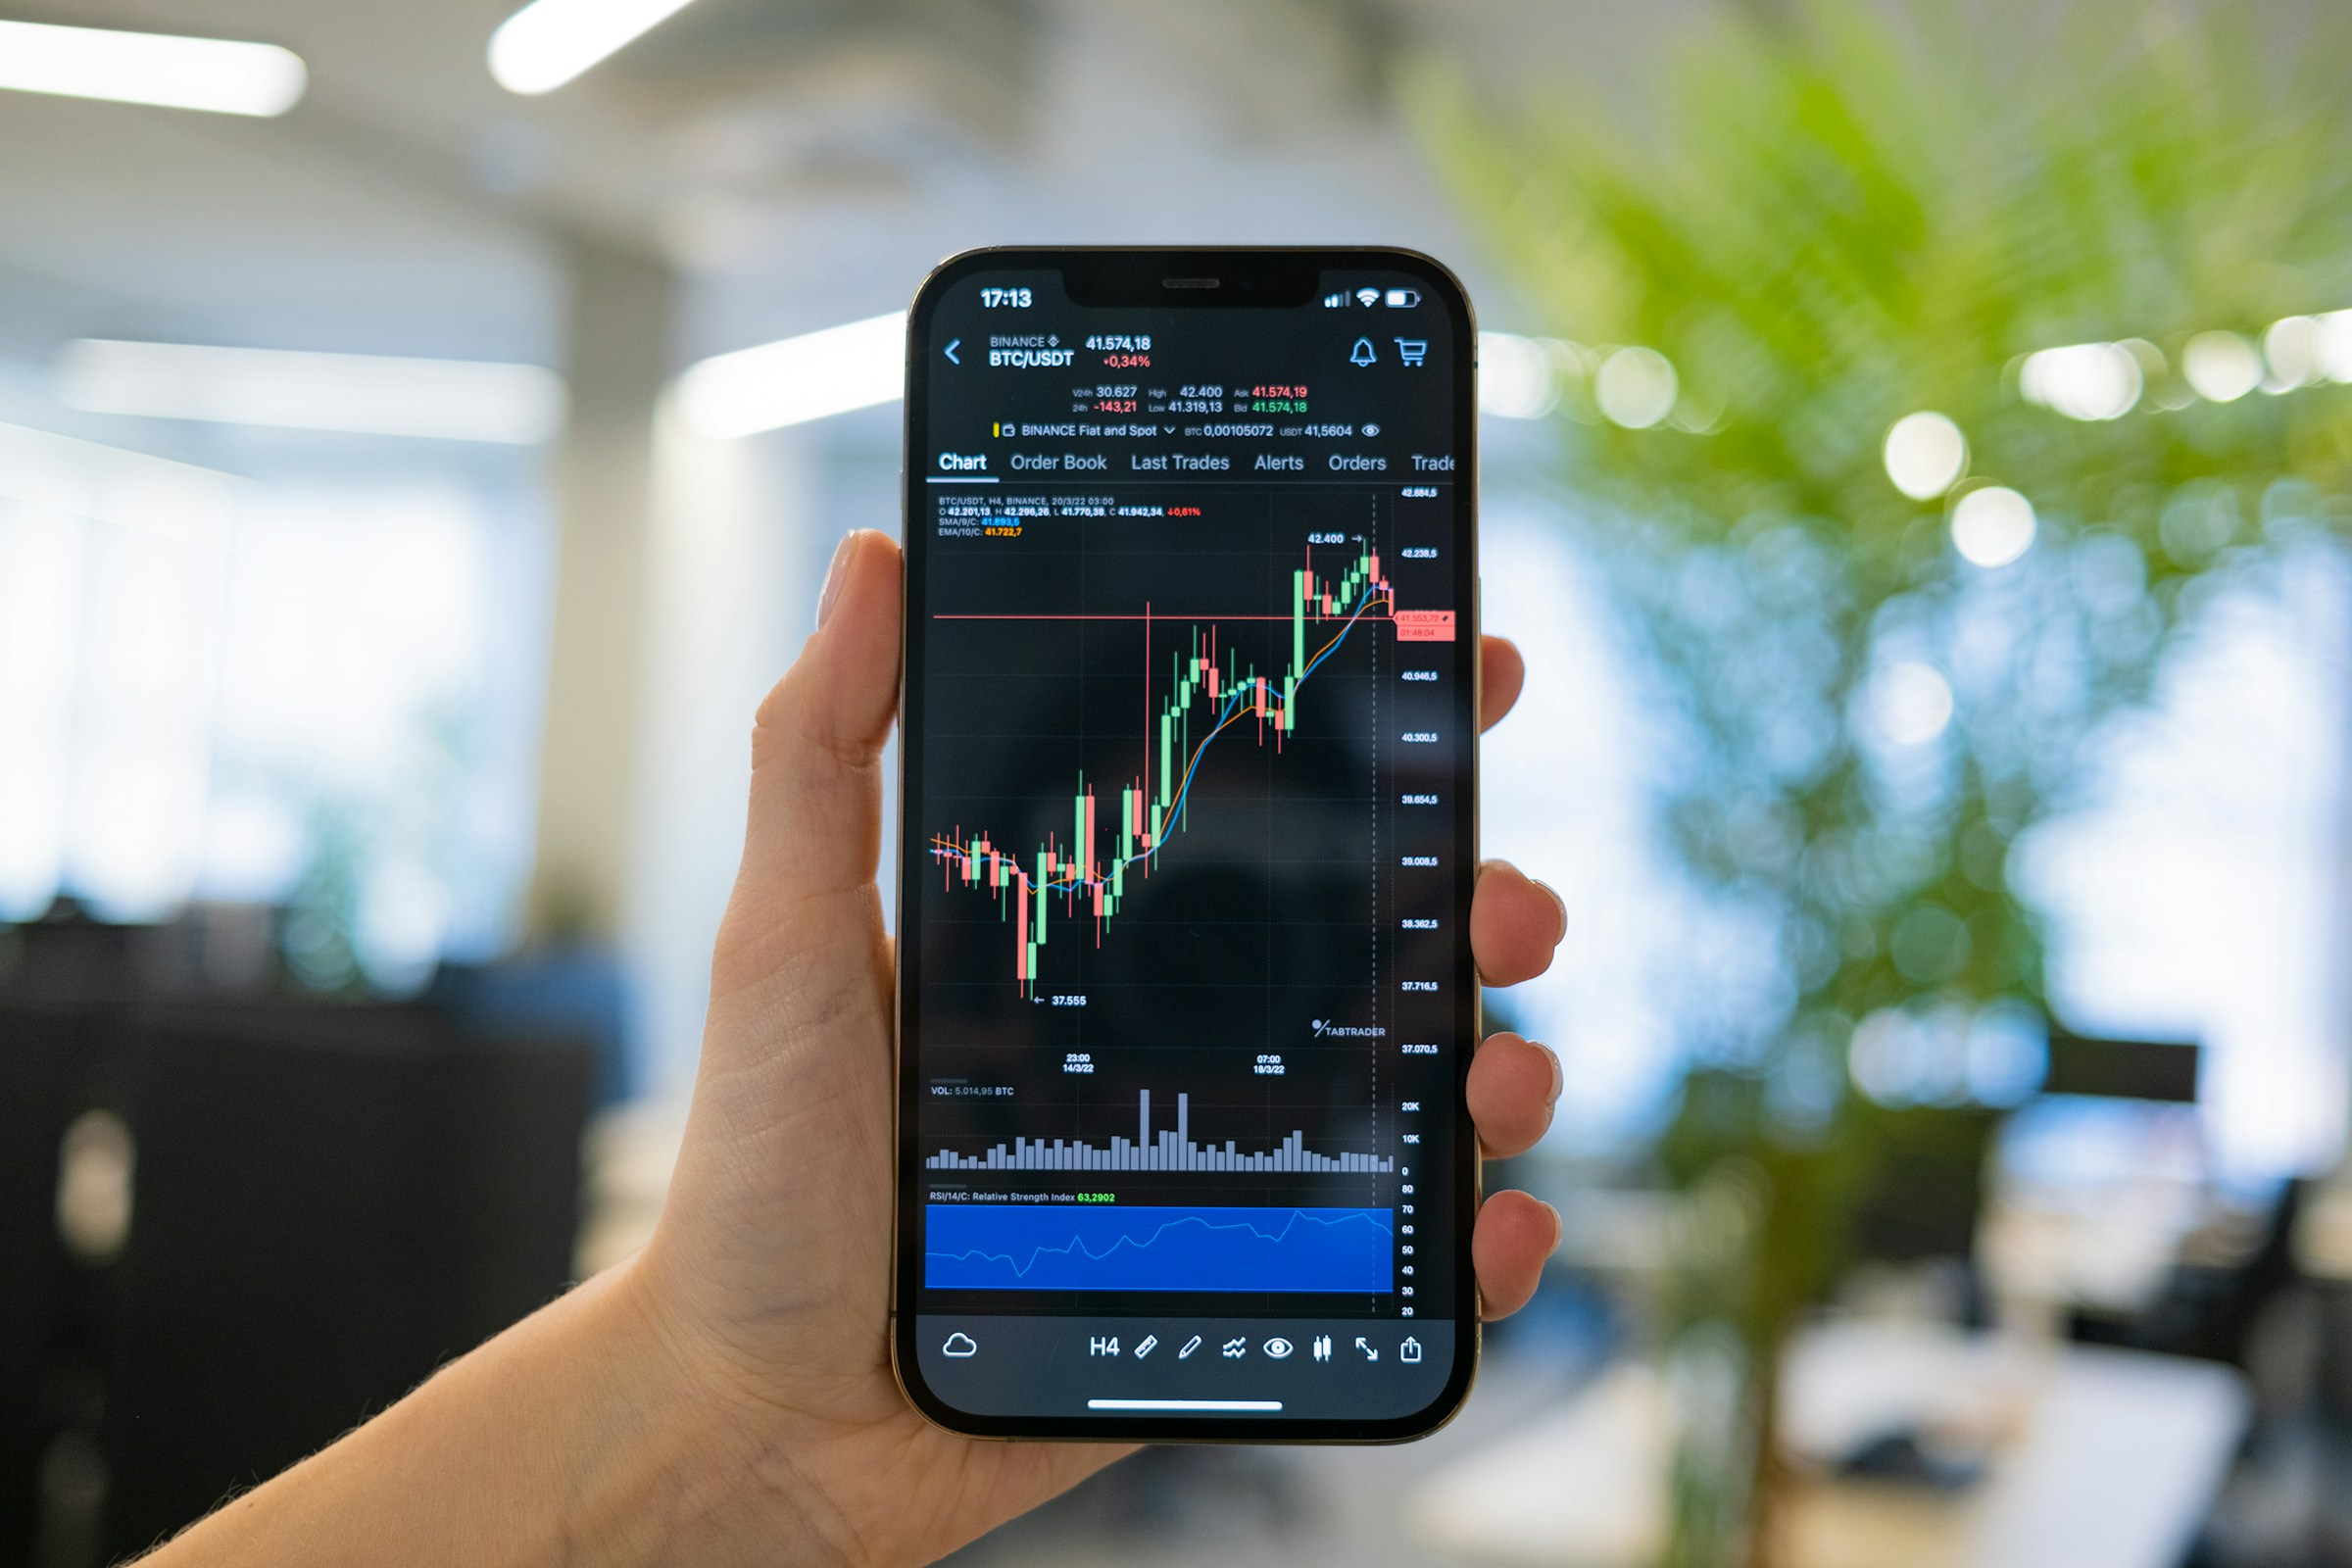
A sudden break of support or a surprise reversal can turn a promising trade into a lesson you do not want to repeat, so spotting patterns fast matters. Day Trading Tips that focus on price action, candlestick patterns, trend lines, support and resistance, breakouts, reversals, volume, and momentum give you the tools to read charts, choose timeframes, and plan entries and exits with sound risk management.
This guide outlines clear, practical ways to identify and utilize key chart patterns in real-time market scenarios, enabling you to trade with greater confidence. What pattern are you ready to master first?
Suppose you want to put those skills to work with funded capital and simple rules. In that case, goat funded trader's prop firm offers access to trading capital, straightforward performance guidelines, and coaching, allowing you to apply pattern recognition in real-time markets without risking all your own money.
10 Day Trading Patterns

1. Cup and Handle
The cup and handle pattern resembles a rounded bowl, followed by a small consolidation area, also known as a "handle." It typically signals the continuation of an uptrend but can also indicate a bearish reversal depending on context. This pattern forms as prices gradually decline, creating the cup, then slightly drop or consolidate, forming the handle, before an upward breakout.
Traders watch for a breakout above the resistance that forms the rim of the cup. Confirmation occurs when the price retests this breakout level and holds, thereby turning the previous resistance into new support. A bullish hammer candle often forms here, reinforcing the buy signal. Stops are placed just below this support line, and potential gains are projected by measuring the height from the cup’s bottom to the breakout point.
2. Triangles
Triangles are versatile chart shapes representing a period of consolidation before a breakout. They come in three types: symmetrical, ascending, and descending, each with distinct implications.
Symmetrical Triangle
Price swings narrow as the trend lines converge. Neither bulls nor bears dominate, increasing the unpredictability of the breakout. Traders wait for confirmed breakout direction and price consolidation to avoid false moves, placing stops mid-channel and using candlestick confirmation to enter.
Ascending Triangle
Displays rising lows with flat resistance. It’s a bullish continuation pattern; price usually breaks above resistance, followed by a retest and a bounce. Stops go just below breakout level, and profit targets equal the triangle’s height.
Descending Triangle
Characterised by a declining upper trendline and flat support, signalling bearish continuation. When the support breaks, prices tend to fall quickly. Traders short after price consolidates below support, with stops placed above it and profit targets defined by the triangle’s height.
3. Flag
Flags indicate brief consolidations following sharp price moves, resembling small rectangles or parallelograms that slope in the opposite direction of the dominant trend. They indicate a pause before continuation.
After a steep rise or fall (the flagpole), prices consolidate in a tight range (the flag). A breakout from this range triggers continuation in the flagpole direction. This pattern works well on 5 to 30-minute charts, with stops just outside the flag and measured profit targets equal to the flagpole’s length.
4. Falling Wedge
The falling wedge is a bullish reversal or continuation pattern where the price forms downward-sloping resistance and support lines that converge over time. Unlike descending triangles, both trendlines slope down.
This pattern often appears after a downtrend as buying pressure builds gradually. An upward breakout signals a strong bullish impulse. Entry follows confirmation and retest, with stops below the wedge’s lower trendline and targets set by the wedge’s height. Volume increases help validate the breakout.
5. Rounding Bottom
The rounding bottom signals a shift from a downtrend to an uptrend, showing a gradual price curvature resembling a bowl without a handle. This pattern marks exhaustion of selling pressure and the return of buyers.
After prices reach a local bottom, consolidation occurs near the support level before a breakout above the resistance (the neckline). Traders enter once the price moves above the neckline, with stops placed below it, targeting a gain equal to the vertical distance between the support and resistance levels.
6. Double Top
Double tops indicate potential trend reversals after an asset tries but fails twice to surpass a resistance level. Price peaks twice, then drops below the support level (neckline), confirming the pattern.
Short entry occurs after this breakout and price consolidation below the neckline. Stops are set just above the neckline, and profits are targeted by measuring the height between the peak and the neckline. This pattern is reliable across multiple timeframes for spotting reversals.
7. Double Bottom
In contrast to the double top, the double bottom suggests a trend reversal from a downtrend to an uptrend. Price tests support twice, failing to break lower, then breaks above resistance.
Buy trades open once the price clears and consolidates above this breakout level. The profit target is derived from the height of the channel formed between the support and resistance levels. Stops are placed below the second bottom, ensuring defined risk.
8. Bullish Hammer
The bullish hammer is a single candlestick with a small body and a long lower wick, signaling that buyers have overcome sellers after a downtrend. Its shape resembles a hammer, indicating strong demand near the support level.
This pattern is most effective near key support levels, especially when preceded by strongly bearish price action. A buy trade is considered after confirmation, with stops just below the hammer’s low. The candle’s colour is less critical than its structure, though green hammers have more substantial bullish implications.
9. Head and Shoulders
This reversal pattern consists of three peaks: a higher middle peak (the head) flanked by two lower peaks (the shoulders). The neckline connects the lows between the peaks, acting as a form of support.
A sell trade activates after the price breaks below the neckline following the formation of the right shoulder. Traders watch for retests of the neckline for safer entries. Targets are calculated by measuring the distance from the head peak to the neckline, and stops are placed just above the broken support.
10. Pennant
Pennants resemble small symmetrical triangles that form after a strong price move (flagpole). They indicate short consolidations before the price resumes its original direction.
The breakout from the pennant’s triangular range signals a continuation of the preceding trend, with targets equal to the flagpole’s length. Stop losses go just beyond the pennant’s boundaries, and traders confirm a volume spike during the breakout for validation.
Which patterns do you see on your watchlist, and how will you validate them with volume, retest, and risk size?
Understanding Day Trading Patterns
Day trading patterns are crucial for navigating the fast-paced market environment. These patterns serve as signposts, indicating potential price movements based on historical behavior. Mastering them helps traders anticipate when a price is likely to continue its trend or reverse, aiding in decision-making about entry and exit points.
Day trading patterns emerge from the natural interplay between buyers and sellers, reflecting market psychology in various forms on charts. They appear quickly within minutes or hours, fitting the short-term nature of day trading. Recognizing these repetitive formations enables traders to capitalize on momentum shifts or reversals effectively.
Ordinary day trading chart patterns include triangles, flags, double tops and bottoms, and head-and-shoulders formations. Each pattern offers distinct clues. For instance, an ascending triangle suggests bullish continuation, while a double top signals a likely trend reversal. Candlestick patterns, such as bullish and bearish engulfing, hammers, and dojis, also provide insights into the strength of buyers or sellers.
Identifying support and resistance levels is key when reading patterns. These levels indicate where the price tends to stall or reverse due to increased buying or selling interest. Patterns near these zones are particularly telling, as breakouts or breakdowns from them can signal firm momentum shifts.
Volume confirmation adds reliability to pattern signals. Increased trading volume during a breakout or reversal validates the move, reducing the chances of false signals. Thus, combining chart patterns with volume analysis enhances trading accuracy.
Successful traders develop the skill to quickly spot and interpret these patterns across various short timeframes, such as 1-minute to 15-minute charts. Practicing pattern recognition sharpens instinct and responsiveness, vital for intraday trading success.
Incorporating technical indicators, such as RSI or MACD, alongside pattern analysis can provide additional confirmation. This multi-layered approach enhances confidence in trade decisions, striking a balance between timing, trend strength, and momentum.
Risk management is essential when trading patterns. Setting clear stop-loss points based on pattern structure minimizes losses if the market moves against the trade. Well-defined target levels also help lock in profits, building discipline and consistency.
Awareness of false signals, such as bull or bear traps, is essential. These occur when the price appears to break out but then reverses sharply, catching traders off guard. Vigilance and validation with other technical tools help avoid these pitfalls.
Overall, understanding day trading patterns enables traders to navigate market fluctuations with greater clarity and less uncertainty. It transforms chart reading into a strategic skill that enhances timing, boosts profit potential, and manages risk with confidence. Consistent practice and integration with other analysis methods create a robust foundation for day trading success.
Checklist For A Repeatable Pattern-Based Trade
Identify the trend and context, mark support and resistance, confirm with volume and an indicator, plan entry and stop-loss, size the position, and then execute with discipline. Review every trade to learn what the chart told you and what you did next.
Goat Funded Trader gives you access to simulated accounts up to $800K with the most trader-friendly conditions in the industry: no minimum targets, no time limits, triple paydays, and up to 100% profit split, all backed by a 2-day payment guarantee and a $500 penalty for delays. Join over 98,000 traders who've already collected more than $9.1 million in rewards, choose customizable challenges or start trading immediately with instant funding, and sign up to Get Access to Up to $800K Today with 25-30% off as your next step with this prop firm.
Related Reading
- Can You Make Money Day Trading
- How Old Do You Have to Be to Day Trade
- Options Trading vs Day Trading
- Day Trading Success Stories
- Day Trading Crypto vs Stocks
- Day Trading Psychology
- Day Trading as a Side Hustle
- Why is Day Trading Restricted
Major Reversal Patterns Used
.jpeg)
Hammer — Buyers Force a Pause in the Downtrend
A hammer candlestick shows a small real body near the top and a long lower shadow after a decline. Sellers pushed the price down, but buyers stepped in and closed near the session high, so the candle registers buying pressure on the price action. In chart patterns, this often marks a test of support where demand overcame supply during the session.
How traders read it: higher volume on the hammer strengthens the signal.
Look for follow-through on the next candle — a bullish close above the hammer body or the high. Use confirmation from nearby support, trendlines, or moving averages before taking a long entry. Typical trade rules: enter on a break above the hammer high, place a stop just below the low, and size risk according to your risk management plan. On short timeframes, expect more false signals; on daily or 4-hour charts, the pattern carries more weight.
Common pitfalls: single hammers are not guarantees. If the next candles fail to confirm or if volume is light, the pattern can act as a pause rather than a reversal. Combine momentum indicators or order flow when possible to enhance your win rate.
Inverted Hammer — Buyers Test the Top, Sellers Hold Ground
An inverted hammer forms at the bottom of a decline with a small body near the low and a long upper shadow. Buyers attempted to push the price higher, but sellers countered, leaving a sign that the selling momentum may be weakening. The bar shows an intraday attempt to reverse that did not fully succeed, yet it signals a possible change in control.
Look for validation before trading: a bullish follow-up candle closing above the inverted hammer’s high gives a clearer entry signal. Volume that rises during the upper wick suggests stronger buying interest. For entries, consider taking a long when the price breaks above the wick, with a stop under the low. Check support zones and intraday swings to align the setup with the overall trend.
Watch for traps: in fast markets, an inverted hammer can be a failed reversal that leads to continued selling. Utilize tight risk management and prefer setups where a key support level or moving average is nearby to minimize stop distance.
Bullish Engulfing Pattern — Buyers Overrun Sellers
A bullish engulfing appears when a smaller bearish candle is followed by a larger bullish candle that thoroughly covers the prior body. That shift signals buyers have taken control in one session, turning a short-term down move into a potential reversal. It is a clear price action takeover in candlestick analysis.
Trade the setup by waiting for confirmation: a close above the engulfing candle’s high on increased volume or a retest that holds as support. Entry options include buying on the break above the engulfing high or on a pullback to the engulfing body. Place a stop below the low of the engulfing candle and set targets using prior resistance or measured moves. On intraday charts, combine with order flow or volume profile to time entries for day trading.
Keep in mind that engulfing patterns that occur within a strong downtrend need stronger confirmation. Use trend context and momentum indicators to avoid jumping into countertrend moves without evidence of a shift.
Bearish Engulfing Pattern — Sellers Reclaim Control
A bearish engulfing forms when a small bullish candle is swallowed by a larger bearish candle that opens higher and closes below the prior body. This pattern signals a swift shift to selling pressure and can mark the beginning of a pullback or a trend reversal. Traders treat it as a warning that the uptrend may be failing.
Confirm with volume and follow through: higher selling volume on the engulfing day increases reliability. Trade approaches include shorting on a break below the engulfing low or waiting for a bounce to the engulfing body as a lower risk entry. Place a stop above the engulfing high and target the next support level or a measured decline. On short timeframes, watch for whipsaws; on higher timeframes, the pattern is more actionable.
Avoid reflexive selling without context. If the move occurs within congestion or near a significant support level, the pattern may produce consolidation rather than a trend change.
Bullish Marubozu — Full Session Buying, No Doubt
A bullish Marubozu has a long body with little or no shadows, where the price opened at the low and closed at the high. That shows uninterrupted buying pressure from open to close and strong momentum in favor of bulls. Traders view this as a decisive session that can precede a continuation or a breakout.
Use it for momentum entries: a Marubozu on higher-timeframe charts can serve as an entry cue when it breaks resistance or accelerates an existing uptrend. Confirm with rising volume and a bullish moving average slope. Set a stop loss under the low of the Marubozu or under a nearby support level. For intraday scalps, combine with intraday structure so you do not chase after a climax run.
Beware of exhaustion runs. A single large Marubozu at the end of a long trend may mark a buying climax. Check RSI or divergence to avoid buying at a potential peak.
Bearish Marubozu — Selling Runs the Session
A bearish Marubozu is the mirror image: the price opens at the low and closes at the high with little shadow. Sellers controlled the entire session, and momentum favors the downside. In price action, this often accelerates a downtrend or confirms a breakdown through a support level.
Trade with explicit rules: short on a break below the Marubozu low or on a rally back into the body as a retest. Confirm with volume and trend indicators. Place a stop above the high of the Marubozu and use a target at the next support zone or a measured move. In intraday setups, combine with VWAP or volume profile to find favorable entry levels.
Watch for panic selling that later retraces strongly. A Marubozu in thin volume markets can mislead; prioritize liquidity and order flow signals.
Doji — Market Hesitation Flags a Possible Turn
A Doji has nearly equal open and close prices, producing a small or absent body and indicating a balance between buyers and sellers. Appearing after a strong move, a Doji signals indecision and a potential shift in momentum. The exact psychology depends on its placement relative to trend, support, and resistance.
Read Doji with context and confirmation. A Doji at a swing high or low gains significance when followed by a candle that breaks the Doji’s range. Combine with volume, divergence on momentum indicators, and nearby chart patterns such as double tops or bottoms. Trade examples: wait for a bullish candle after a Doji at support before entering long, or short after a firm break below a Doji at resistance. Use tight stops since Doji alone are weak signals.
Ask about the timeframe you trade and the filters you use. That helps pick the most useful patterns for your intraday or swing setups.
Common Strategies Based on Pattern Recognition

Symmetrical Triangle Breakouts: Where to Enter and How to Protect Capital
Symmetrical triangles show price squeezing between converging trend lines as buyers and sellers reach a temporary balance. Which side will win? Traders watch for a decisive candle close beyond the upper or lower trend line, accompanied by an apparent increase in volume, to confirm the breakout. Enter at the breakout candle close or on a quick pullback to the breakout line for a lower risk entry.
Place a stop loss beyond the opposite trend line or just past the last swing high or low to limit downside. Estimate the price target by measuring the triangle height at its widest point and projecting that distance from the breakout level to produce a calculated move. Watch for false breakouts; require a volume spike or a supporting indicator signal to reduce the chance of being shaken out.
Candlestick Clues: Using Hammer and Doji to Spot Turnarounds
What do single candles tell you about sentiment? A hammer after a decline shows buying interest when the price rejects lower levels and closes near the open. A doji signals indecision when the open and close nearly match, often appearing at turning points. Use the candle in context: confirm a hammer with rising volume or a bounce above nearby support.
Treat a doji as a red flag when it appears at resistance and as a setup when it shows up near support, combined with bullish divergence on RSI. Avoid trading a single candle alone; pair it with trend lines, support and resistance, or a momentum indicator for higher probability entries.
Mixing Indicators with Pattern Recognition: How to Cut False Signals
Patterns gain reliability when technical indicators confirm the move. Ask which indicators add weight to your pattern signal. Use moving averages to define trend bias and confirm breakouts when price clears a key average. Use VWMA to track price behavior where volume matters; VWMA can show whether large trades are driving the move.
Check momentum using RSI or MACD for divergence that indicates weakening trends. Look at on-balance volume or volume spikes at breakout points for conviction. Keep the indicator count small so you avoid conflicting signals and decision paralysis.
Risk Rules: Position Sizing, Stop Loss, and Daily Loss Caps
How much are you willing to lose on one trade? Define a fixed percentage of equity per trade, typically 0.5 to 2 percent, and size the position so that the dollar risk equals that limit. Place stop losses outside pattern boundaries or beyond a multiple of ATR to allow normal intraday noise.
Use a risk-reward framework that targets at least 1 to 2 and prefers 1 to 3 or higher when the edge is clear. Set a daily loss cap and stop trading for the day if you hit it. Use mental checks, like reducing size after several consecutive losses, to protect capital and preserve discipline.
Volume and Profit Taking: Confirm Moves and Lock In Gains
Which exits capture gains while protecting against reversal? Use volume to validate breakouts and reversals. High volume at breakout implies participation and increases the odds of follow-through. If volume is weak, expect choppy prices and a higher risk of false breakouts.
Set profit targets using measured moves from chart patterns, prior support and resistance zones, or scale out positions in tranches at incremental targets to lock profits and let the remainder run with a trailing stop using ATR or a moving average. Combine volume behavior and price action near targets to decide whether to exit partially or hold for extended momentum.
Related Reading
- How Much Can You Make Day Trading With $1,000
- Day Trading Indices
- What is Liquidity in Day Trading
- Can You Start Day Trading With $100
- Day Trading as a Career
- Why is Pattern Day Trading Illegal
- Are Day Trading Courses Worth It
- Best Brokerage for Day Trading
- Best Cryptos for Day Trading
- What is Day Trading Buying Power
- Best Time Frame for Day Trading
Tips for Using Patterns Effectively in Day Trading
.jpeg)
Practice Pattern Recognition Like a Repetition Skill
Spend time every day scanning historical charts and replaying price action. Pick one pattern per week — double tops and bottoms, head and shoulders, triangles, wedges, flags — and mark every occurrence across different stocks or futures. Use a chart replay tool to watch how those patterns formed and how price behaved at breakouts and retests.
Ask yourself: What did volume do on the breakout? Where were the swing highs and swing lows, and how long did the pattern take to complete? Create a simple checklist for each pattern, including structure, breakout candle, retest, volume confirmation, and stop placement. That checklist turns visual recognition into a repeatable skill.
Combine Patterns with Technical Indicators for Confirmation
Treat chart patterns as context and indicators as confirmation signals. For example, when you see a double bottom, check RSI for oversold bounce or a bullish divergence. Use moving averages to confirm trend alignment; a breakout above the 20 or 50-period moving average on your entry timeframe adds weight to the trade.
Look for MACD crossovers or momentum increases at the breakout. Volume matters: A breakout with volume 20 percent above its recent average shows conviction. Use at least two confirming signals before risking capital so you reduce false pattern trades and sharpen entry timing.
Implement Strict Risk Management That Protects Capital
Define risk per trade as a fixed percentage of the account capital, typically ranging from 1 to 2 percent. Calculate position size from that number and the distance between your entry and stop loss. Place stops beyond a clear price invalidation point, such as below the pattern low, below the recent swing low, or beyond an ATR multiple like 1.5 times the ATR on your entry timeframe.
Set profit targets by nearby resistance or by measured move targets from the pattern size. Use risk-reward ratios of at least 1 to 2 when possible and consider scaling out of winners to lock gains while leaving a running portion to capture extended moves.
Stay Alert to Market News and Event-Driven Volatility
Always consult an economic calendar before the start of the session. Central bank releases, jobs data, earnings, and geopolitical headlines can flip a clean pattern into chaos within seconds. If you plan to trade around major events, use a smaller size, wider stops, or step out until the market settles.
Watch implied volatility in options if trading stocks; sudden option skew changes and large sweeps in volume often precede fast moves. When news drives the market, let price prove a setup with a clean close and volume confirmation rather than assuming the chart pattern will hold.
Be Patient and Trade Only the Best Setups
Wait for patterns to form and for your confirmation rules to align. Avoid entering incomplete patterns or relying solely on wishful thinking. Use time confirmation when appropriate: a candle close above a breakout level on your chosen timeframe or a retest that holds on a five-minute chart can be the difference between a winner and a trap. If the setup lacks confirmation or if it violates your checklist, skip the trade. Ask yourself before entry. Does this meet my pattern rules, indicator signals, and risk profile today?
Understand Timeframes and Read the Market Mood
Start with the higher timeframe to set bias, then zoom in to find entries. A triangle breakout on a daily chart carries more weight than the same pattern on a one-minute chart. Align your trade with the higher-timeframe trend to increase your chances of success. Use the daily or hourly chart to identify support and resistance, and use the five- or fifteen-minute chart for execution. Check correlations across related instruments and sector indices to gauge market sentiment and avoid trading against the broad market flow.
Spot False Breakouts and Avoid Traps
False breakouts exhibit quick rejection, low participation volume, failure to close above the level, or divergence on momentum indicators. Watch for long wick candles that reverse immediately after a breakout or for breakout candles that form on lower than average volume. A reliable tactic is to wait for a retest of the broken level and enter only if the price holds and volume confirms. Another approach is to use a smaller size on the initial breakout and add if the price proves itself on a retest or continues with momentum.
Maintain Emotional Control with Rules and a Trading Routine
Create a trade plan and a pre-trade checklist that you follow before every entry. Log every trade in a journal with entries for setup, entry trigger, stop, target, and emotion at trade time. Use automated orders to remove impulsive manual deletions of stops. If you hit your daily loss limit, stop trading for the day to avoid revenge trades. Practice breathing or take short breaks after big wins or losses to return to a clear decision-making state. Which single rule could you enforce today to reduce emotional trading behavior?
Examples of Using Patterns in Day Trading
.jpeg)
1. Trading the Bullish Pennant on a 15 Minute Bitcoin Chart
Pattern identification and context
After a sharp rally, the price compresses into a small symmetrical triangle that slopes slightly downward. That consolidation on a 15-minute chart forms the pennant. It shows a brief pause in a strong uptrend, maintaining the prior momentum while buyers and sellers balance for a short time. Which higher timeframe trend do you confirm
before trading this pattern?
Volume and indicator confirmation
Volume typically tapers during the pennant. A clean setup displays falling volume during consolidation and a fresh volume pickup when the price breaks above the upper trendline. Use MACD or a short-term moving average crossover to confirm bullish momentum ahead of entry. RSI can warn of hidden bearish divergence if it fails to make higher lows.
Entry and order execution
Place a buy order when the price closes above the upper trendline, accompanied by noticeably higher volume. For speed, you can use a market order on the breakout or a stop entry a few ticks above the trendline to avoid premature fills. How will you handle slippage in fast-moving cryptocurrencies?
Risk controls and position sizing
Set a stop loss below the lower trendline or under the pennant low. Size the position so that a breach of the stop equals a small, predefined percentage of account equity. Move the stop to breakeven after a confirmed retest or after a measured partial gain has been achieved.
Profit target and trade management
Measure the initial rally height, the flagpole, and project that distance above the breakout for a take-profit zone. Consider scaling out in portions and letting the remainder run with a trailing stop based on a moving average or swing lows. Watch for breakout failure, where the price snaps back into the pennant on weak volume, and cut the trade quickly.
2. Shorting a Rising Wedge on a 5 Minute Tech Stock Chart
Pattern recognition and warning signs
A rising wedge makes higher highs and higher lows inside converging trendlines during an uptrend. It signals a loss of momentum as buyers push prices with smaller increments. The pattern forms quickly on a 5-minute chart in liquid tech names and can precede sharp intraday reversals. Do you check premarket news or scheduled events before taking a short here?
Volume and confirmation reads.
Volume often declines through the wedge. A valid short trigger shows a spike in selling volume on a break below the lower support line. Look for bearish divergence on RSI or falling MACD histogram to strengthen the case.
Entry mechanics
Enter short when price breaks and closes beneath the lower trendline with increased volume. Consider a sell stop a few ticks below the trendline to avoid a false breakdown on a wick. Use level two or time and sales data for fast reads in active stocks.
Stops and exit planning
Place a stop loss above the recent swing high inside the wedge. Calculate your position size so that your loss if stopped out stays within your risk tolerance. Set a take profit by measuring the wedge height and projecting downward, or by targeting a nearby support zone. If the breakdown stalls or reverses, exit immediately rather than averaging into a losing short.
Risk features specific to tech.
Watch for rapid reversals from news, earnings surprises, or block buying. Utilize tight risk control and avoid prominent positions in names prone to short squeezes. Do you prefer smaller, repeatable gains or one larger directional trade on the wedge?
3. Swing Trading the Cup and Handle on a 30 Minute Tesla Chart
Pattern anatomy and setup
The cup features a rounded bottom, indicating that it has accumulated. The handle follows as a shallow consolidation or slight pullback on lighter volume. On a 30-minute chart, this pattern often rewards patience and offers a clear resistance level at the handle rim. Which daily trend will you use to align this swing with bigger momentum?
Confirming signals and volume profile
Volume should decline through the cup and compress in the handle, then spike at breakout. RSI moving off neutral and a rising MACD support a cleaner breakout. Volume confirmation matters more than the exact shape of the breakout candle.
Executing the trade
Enter long when the price closes above the handle resistance with above-average volume. Use a limit entry at or slightly above the breakout for better execution when volatility is low. For swing trades, you can add size after a clean retest of the breakout.
Stop loss and target math.
Set a stop loss below the lowest point of the handle. Project the cup depth from the breakout point to estimate a realistic take profit. Protect gains with a trailing stop or by shifting stops to breakeven after a reasonable move.
Practical trade management
Check broader market conditions and news that could disrupt momentum. Use position sizing to keep maximum loss defined and avoid adding size on the way down. If the breakout fails and price closes back under resistance on rising volume, exit and reassess the trade setup. How will you monitor overnight risk and catalysts for a swing held multiple sessions?
Get 25-30% off Today - Sign up to Get Access to Up to $800K Today.
Goat Funded Trader offers traders access to simulated accounts of up to $800,000, featuring favorable conditions for traders. You face no minimum profit targets and no time limits while you prove your edge. Choose customizable challenges if you prefer structured goals, or start trading immediately with instant funding. Payouts include triple paydays and profit splits up to 100 percent. More than 98,000 traders have collected over $9.1 million in rewards, and payments are cleared within a two-day payment guarantee, with a $500 penalty for delays. Ready to test your approach? Sign up to get access to up to $800,000 today and receive 25 to 30 percent off.
Match Funding Choices to Your Day Trading Style
Scalpers need tight fills and low latency. Momentum traders chase volume and fast breakouts. Pullback traders look for confluence at moving averages and trendlines. Goat Funded Trader supports all these styles through simulated accounts that mirror real-world conditions, allowing you to sharpen your order entry, order management, and exit techniques without time pressure. Which intraday timeframes do you trade most often, and how do you prefer to size positions during a breakout?
High Probability Day Trading Patterns You Should Master
Recognize price action and chart patterns that appear over and over. Key patterns include breakout and retest, flag and pennant continuation, triangle squeezes, double tops and bottoms, head-and-shoulders reversal setups, and gap-and-go setups. Candlestick patterns, such as engulfing bars, hammers, and shooting stars, offer clues about support and resistance levels. Combine pattern recognition with volume spikes, moving average alignment, RSI or stochastic divergence, and MACD cross confirmation to distinguish between noise and genuine setups.
How to Read Price Action, Volume, and Order Flow for Execution
Start with context on a higher timeframe, then drop to the intraday chart where you execute. Mark support and resistance, draw trendlines, and note recent consolidation and liquidity pockets. Watch the volume as the price approaches these levels; a volume surge on a breakout or a quiet retest increases the probability. Use timeframes like one minute for scalps, five minutes for typical day trades, and fifteen minutes for broader bias. Use level two and tape reading where available, to confirm aggressive buying or selling before sizing an entry.
Concrete Trade Management Steps for Intraday Patterns
Enter only with an apparent trigger: break and hold, retest and reject, or candlestick confirmation at a confluence zone. Place a defined stop loss based on price structure, not an arbitrary percentage. Scale out partial positions at predetermined targets and trail the remainder with an objective rule, such as a moving average or swing low protection. Track trade performance in a journal: entry reason, setup type, time of day, volume context, and result. Repeated small wins compound; one disciplined approach beats impulsive guessing.
Risk Controls That Keep You Trading Longer
Set maximum loss per trade and per day as fixed amounts you can tolerate. Use position sizing that respects those limits. Watch for correlation risk when multiple positions hinge on the same sector or news event. Utilize the simulated account environment to stress-test worst-case scenarios and validate drawdown management. The lack of time limits and minimum targets reduces forced behavior that often leads to overtrading.
Checklist Before Taking a Funding Challenge
Confirm platform latency, data feed quality, and commission schedule: Backtest pattern rules and forward test in the simulated account. Verify drawdown rules, payout timing, and the profit split for each funding path. Practice entries and exits at the time of day you will trade. Prepare a simple trading plan with clear triggers, stops, and targets before you begin the challenge.
Related Reading
- Best Rsi Settings for Day Trading
- Best Moving Average for Day Trading
- Day Trading Checklist
- Day Trading Technical Analysis
- Best Markets for Day Trading
- Day Trading Indicators
- Stocks for Day Trading
- Day Trading Books
- Best Tools for Day Trading
- Day Trading Rules
- Day Trader Salary
- Best Day Trading Stocks
- How to Day Trade for a Living
- Best Stocks to Day Trade
- Is Day Trading Legal
Be Great and get the App


.webp)


