


Day Trading Technical Analysis Guide
Learn how traders use charts, indicators and price action to make short-term decisions, with examples of technical analysis applied to real market setups.

You watch a chart as price spikes, then reverses, and wonder which indicator to trust and where to set your stop loss. Day Trading Tips that focus on technical analysis can turn that uncertainty into clear actions by teaching you to read moving averages, support and resistance, trend lines, volume, candlestick patterns, and oscillators like RSI and MACD.
Which signals matter now, and how do you time entries and exits across different timeframes to protect capital and capture momentum? This guide lays out simple chart reading, entry and exit rules, risk management, and trade filters so you can identify trends and make precise decisions with more confidence.
To put those methods to work, Goat Funded Trader's prop firm gives traders funded accounts, straightforward risk rules, and a real trading environment where you can apply indicator-based strategies, test breakout and reversal setups, and scale your gains without risking your own capital.
30 Best Day Trading Technical Analysis Indicators
Day trading requires quick decisions backed by reliable tools to analyze market trends, momentum, volume, and price action. Technical indicators transform raw price and volume data into meaningful signals that help traders anticipate market moves, identify entry and exit points, and manage risk. These indicators fall into several broad categories: price-based, volume-based, breadth, overlays, and non-chart-based.
Below is a curated list of 30 technical analysis indicators ideal for day traders, organized by category and explained with clarity for practical use.
Price-Based Indicators
1. Moving Average (MA)
The Moving Average smooths price data by calculating an average over a specific period, highlighting trend direction. Variants include Simple Moving Average (SMA) and Exponential Moving Average (EMA), with EMAs weighting recent data more heavily.
2. Average Directional Index (ADX)
Measures the strength of a trend regardless of direction. A rising ADX indicates a strong trend, while a falling ADX suggests a weakening trend.
3. Average Directional Movement Rating (ADXR)
A smoothed version of the ADX that measures the trend’s rate of change, offering more stable signals in volatile markets.
4. Commodity Channel Index (CCI)
Detects cyclical trends by comparing the current price to a moving average of prices over a set period. Helpful in spotting overbought or oversold conditions.
5. Coppock Curve
A momentum indicator designed initially to identify long-term bottoms, useful for spotting trend reversals and new buying opportunities.
6. Moving Average Convergence Divergence (MACD)
Tracks the relationship between two EMAs, signaling momentum via crossovers and divergences.
7. Momentum Indicator
Measures the velocity of price changes over a specified timeframe, showing whether momentum is accelerating or decelerating.
8. Relative Strength Index (RSI)
An oscillator scaled from 0 to 100, indicating overbought conditions above 70 and oversold conditions below 30, helping traders spot potential reversals.
9. Stochastic Oscillator
Compares the current price with a recent high-low range to identify overbought and oversold levels, which can hint at impending price reversals.
10. Trix
A triple-smoothed moving average oscillator that captures both trend and momentum, reducing noise for clearer trading signals.
11. KDJ Indicator
A variation of the stochastic oscillator incorporating a “random index” to analyze price changes effectively in short-term trading.
Volume-Based Indicators
12. On-Balance Volume (OBV)
Combines price and volume to predict price movements by showing whether volume is flowing into or out of an asset.
13. Money Flow Index (MFI)
Incorporates volume weighted by price, measuring buying and selling pressure. Values above 80 or below 20 indicate potential reversals.
14. Negative Volume Index (NVI)
Assumes “smart money” trades on low-volume days; tracks price action relative to days with decreased volume.
15. Positive Volume Index (PVI)
Complements NVI, focusing on days when volume increases to identify activity from less-informed traders.
16. Williams Accumulation/Distribution
Analyzes divergence between price and volume to indicate whether traders are accumulating (buying) or distributing (selling).
Breadth Indicators
17. Advance-Decline Line (A/D Line)
Tracks the net difference between advancing and declining stocks within an index, indicating market strength or weakness beyond price moves.
18. Arms Index (TRIN)
A ratio of advancing/declining stocks and their relative volume; values below one suggest bullishness, above one bearishness.
19. McClellan Oscillator
Measures the momentum of advancing and declining stocks using exponential moving averages, which helps identify divergences and potential turning points.
Overlay Indicators
20. Bollinger Bands
A volatility indicator plotting a moving average with upper and lower bands set two standard deviations away, signaling potential overextensions and mean reversions.
21. Price Channels
Enclosed by upper and lower trendlines, they help identify consolidation zones and breakout opportunities.
22. Fibonacci Retracement Lines
Used to find potential support and resistance by plotting horizontal lines at key Fibonacci levels after a significant price move.
23. Ichimoku Cloud
An all-in-one indicator that identifies trend direction, momentum, support, and resistance at a glance.
24. Parabolic SAR (Stop and Reverse)
Designed to highlight potential short-term trend reversals, this tool is best applied in trending markets.
25. Pivot Points
Calculated from the previous day’s open, high, low, and close, these points act as potential support/resistance levels useful for day traders.
26. Trend Lines
Drawn by connecting multiple highs or lows, trend lines help identify the direction and strength of market trends and potential breakout points.
Non-Chart-Based Indicators
27. Put/Call Ratio
Measures the volume of put options relative to call options to gauge market sentiment; extremes can be contrarian indicators.
28. Implied Volatility
Derived from options’ prices, it reflects the market’s forecast of future volatility and trader sentiment.
29. Short Interest
Tracks the number of shares sold short but not yet covered, which helps identify bearish sentiment or potential short squeezes.
30. Fear and Greed Index
Aggregates various market sentiment measures to determine whether investors are excessively fearful or greedy, often preceding reversals.
Related Reading
- Can You Make Money Day Trading
- How Old Do You Have to Be to Day Trade
- Options Trading vs Day Trading
- Day Trading Success Stories
- Day Trading Crypto vs Stocks
- Day Trading Psychology
- Day Trading as a Side Hustle
- Why is Day Trading Restricted
What is Technical Analysis?

How Technical Analysis Guides Your Day Trading Moves
Technical analysis treats price and volume as the only raw signals. Traders read charts to find supply and demand shifts, trend direction, and momentum. Patterns on candlestick charts and changes in volume reveal where traders are active and where the price might react next.
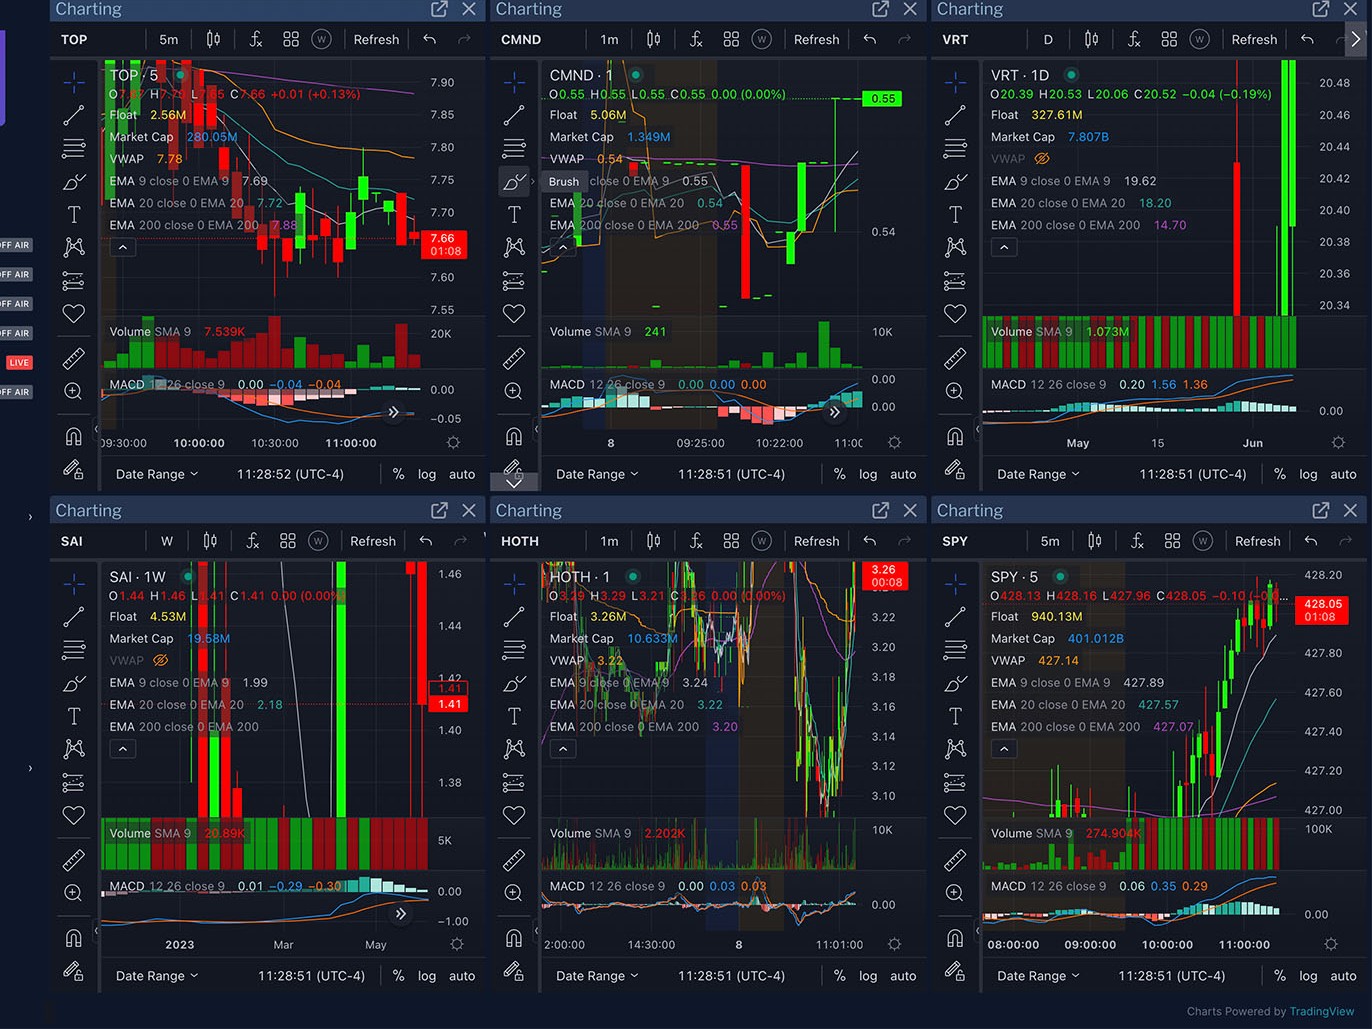
Chart Tools That Make Sense for Intraday Trading
Which charts work best for quick decisions? Candlestick charts show an open, high, low, and close structure that traders use to spot rejection candles and continuation patterns. Timeframe choice matters: one-minute, five-minute, and fifteen-minute charts give different views. Volume profile and VWAP act as intraday anchors to show where institutions place trades.
Indicators and Oscillators You Will Actually Use
Keep indicators purposeful. Use EMA and SMA for trend slope and crossovers. Use RSI and stochastic to watch momentum and overbought or oversold readings. Use MACD for trend confirmation and divergence signals. ATR measures volatility and helps set realistic stop loss distances. Bollinger Bands show volatility expansion that often precedes strong moves.
Price Action, Structure, and Support Resistance
Draw trendlines and mark horizontal support and resistance before the market opens. Watch for breakouts from consolidation, failed breakouts that reverse, and pullbacks to structure that offer cleaner entries. Use Fibonacci retracement to locate logical pullback levels and confluence zones where multiple signals line up.
Timeframes and Strategy Fit
Match your strategy to a timeframe. Scalpers need fast execution and tight risk on one-minute and five-minute charts. Momentum traders use fifteen minute and thirty-minute charts to ride strong intraday trends. Multiple timeframe analysis helps confirm the higher timeframe trend while timing entries on the lower timeframe.
Practical Entry and Exit Rules
Define your trigger and your risk before you enter. Triggers can be a breakout confirmed by volume, a moving average crossover, or a rejection candle at a prior high. Place stops beyond logical structure or use ATR-based stops to account for volatility. Plan your take profit based on nearby resistance, measured move, or risk-reward targets, and use trailing stops to lock profits.
Backtesting, Paper Trading, and Validating an Edge
Backtest setups with a clear rule set and enough samples to avoid random results. Conduct a forward test with a small size in live conditions to identify potential slippage and real-time execution issues. Track win rate, average win and loss, and expectancy so you know whether a setup earns an edge in actual markets.
Risk Management and Trade Size Discipline
Limit risk per trade to a small percentage of capital and check correlation across positions so you do not double down on the same market exposure. Control daily drawdown limits and stop adding risk after losses. Position size should reflect stop distance so risk stays consistent.
Standard Failure Modes to Avoid
Avoid indicator overload and curve fitting where you tweak rules to fit past data. Watch for low liquidity, news events that spike volatility, and lagging signals when market conditions change. False breakouts and whipsaws cost capital when you trade without clear trade management.
A Simple Intraday Checklist to Use Before You Click
Scan premarket action and mark levels of interest. Note VWAP and high volume nodes. Pick a handful of setups and size the risk accordingly. Confirm your entry trigger, place the stop, and set the first target. Execute with discipline and log the trade for later review.
Does Technical Analysis Work on Day Trading?

Technical analysis can work for day trading when you use it as a probability tool rather than a crystal ball. Price action, support and resistance, trendlines, and candlestick patterns give you a map of what other traders are doing right now. Add indicators like moving averages, RSI, MACD, VWAP, and ATR to measure momentum, volatility, and average true range. Watch volume and order flow for confirmation; rising volume on a breakout reduces the chance of a false breakout. Which setups do you trust most on your intraday charts?
Key Technical Tools Traders Rely On
Candlestick charts, tick charts, and time frame charts form the visual base. Moving averages show trend and dynamic support. RSI and stochastic flag overbought or oversold momentum. MACD signals shifts in momentum and can help time entries or exits. Volume profile and level II data reveal liquidity and where big traders place interest. VWAP helps intraday traders see the intraday value area and align trades with institutional flow.
How to Use Technical Analysis in Real Time
Start with a clear plan, pick a price action bias, set entry triggers, and size positions with fixed risk per trade. Use a simple setup trend direction on a higher time frame, pullback to a moving average or support, confirmation candle, and volume spike for entry. Place a stop under the structure and set a reward target that makes sense for the intraday volatility. Use alerts for price levels and practice quick execution so slippage and latency do not eat profits.
Where Technical Analysis Breaks Down and How to Protect Capital
Technical analysis can fail in low liquidity, during big news, or when algorithms overwhelm price patterns. False breakouts and whipsaws happen frequently in thin markets and near economic releases. Protect yourself with position limits, volatility filters such as ATR-based stops, and rules to avoid trading during major news unless your plan covers it. Relying solely on one indicator invites blind spots.
Blending Price Action with Order Flow and News
Combine chart signals with order flow, tape reading, and Level II to see who is behind a move. Order flow shows whether market makers or institutions push aggressively or if retail traders drive a move. Watch economic releases and corporate news for catalysts that can override technical setups. Use sentiment data and short interest as context to each trade without letting news noise dominate execution.
Practice, Backtesting, and Risk Management That Save Capital
Backtest setups on historical intraday data and forward test in a simulator or small live size before scaling. Track win rate, average win-loss ratio, max drawdown, and expectancy. Keep a trading journal with screenshots and trade notes to refine entry timing and risk rules. Risk no more than a small percentage of capital on a single trade and adjust position size to current volatility.
Questions to Keep You Sharper While Trading
What time frame gives you the cleanest edge? Which indicator do you ignore because it generates too many false positives? How will you handle a sudden spike in volatility or an overnight gap against your intraday bias?
Get funded without risking more personal capital with Goat Funded Trader. As a prop firm, Goat Funded Trader gives you access to simulated accounts up to $800K with trader-friendly conditions, including no minimum targets, no time limits, triple paydays, and up to 100% profit split. Join over 98,000 traders who have collected more than $9.1 million in rewards, backed by a 2-day payment guarantee with a $500 penalty for delays. Choose customizable challenges or instant funding and sign up to Get Access to up to $800 today, and 25% off.
Assumptions in Technical Analysis

Technical analysis is a popular approach used by many traders and investors to forecast market movements. Unlike fundamental analysis, which examines economic data and company specifics, technical analysis focuses primarily on price action, volume, and trends. The foundational beliefs that support this methodology rest on certain key assumptions about how markets behave.
Price History is Cyclical
One of the core assumptions in technical analysis is that market behavior tends to repeat itself over time. This cyclicality is rooted in human psychology. Emotions such as greed, fear, optimism, and pessimism often lead to recurring patterns in buying and selling. While past price movements may not repeat exactly, they follow recognizable rhythms that can manifest in both short-term fluctuations and long-term market cycles.
A practical example lies in the business cycle, where markets generally experience periods of expansion and contraction. During economic expansions, stock prices and risk-on assets usually experience gradual gains. Conversely, during recessions, markets often face steep declines. This cyclical nature presents technicians with opportunities to anticipate potential market turns by studying historical price behaviors.
Market Prices Reflect All Information
Another vital assumption underpins the notion that current prices already incorporate all known information regarding an asset. This means that technical analysis does not try to “predict” fundamental events themselves but instead interprets how the market values that information as it becomes available. The moment new data, such as inflation figures or interest rate announcements, are released, market prices adjust to reflect the news.
By analyzing these price changes and the corresponding volume and volatility, technical analysts infer the market’s sensitivity to specific events. For example, if inflation comes in higher than expected, observing subsequent moves in equities, currencies, and bond yields can provide insights into market reactions. This approach helps in formulating risk management strategies by stress-testing how portfolios may respond to economic surprises.
Price, Volume, and Volatility Follow Trends
A crucial premise in technical analysis is that market movements are not random but occur in identifiable trends. Rather than prices moving unpredictably, they tend to flow in directions over varying time frames (uptrends, downtrends, or sideways consolidations). Traders use patterns such as support and resistance levels to anticipate how prices might behave during these trends.
For instance, a trader analyzing the EUR/USD currency pair might identify a strong downtrend triggered by divergent monetary policies. During this downtrend, the trader may look for short-selling opportunities when prices bounce briefly toward resistance levels. Conversely, in periods of consolidation, the trader might adopt range-bound strategies by buying near support and selling near resistance.
Understanding trends enhances decision-making because it offers a structured framework to evaluate risk and reward. Identifying when a trend is likely to continue or reverse is central to capitalizing on trading opportunities.
Adapt your tactics to your timeframe. For day trading, test setups on 1-minute, 5-minute, and 15-minute charts while confirming bias on the 1-hour or daily chart. For scalping, rely on order flow and tight ATR-based stops. For intraday swing trades, prefer pullback entries and larger targets. Maintain a trading journal, backtest each pattern, and track slippage and execution across sessions to determine whether a setup remains profitable after fees and spreads. Which trend setup produces your best risk-adjusted returns?
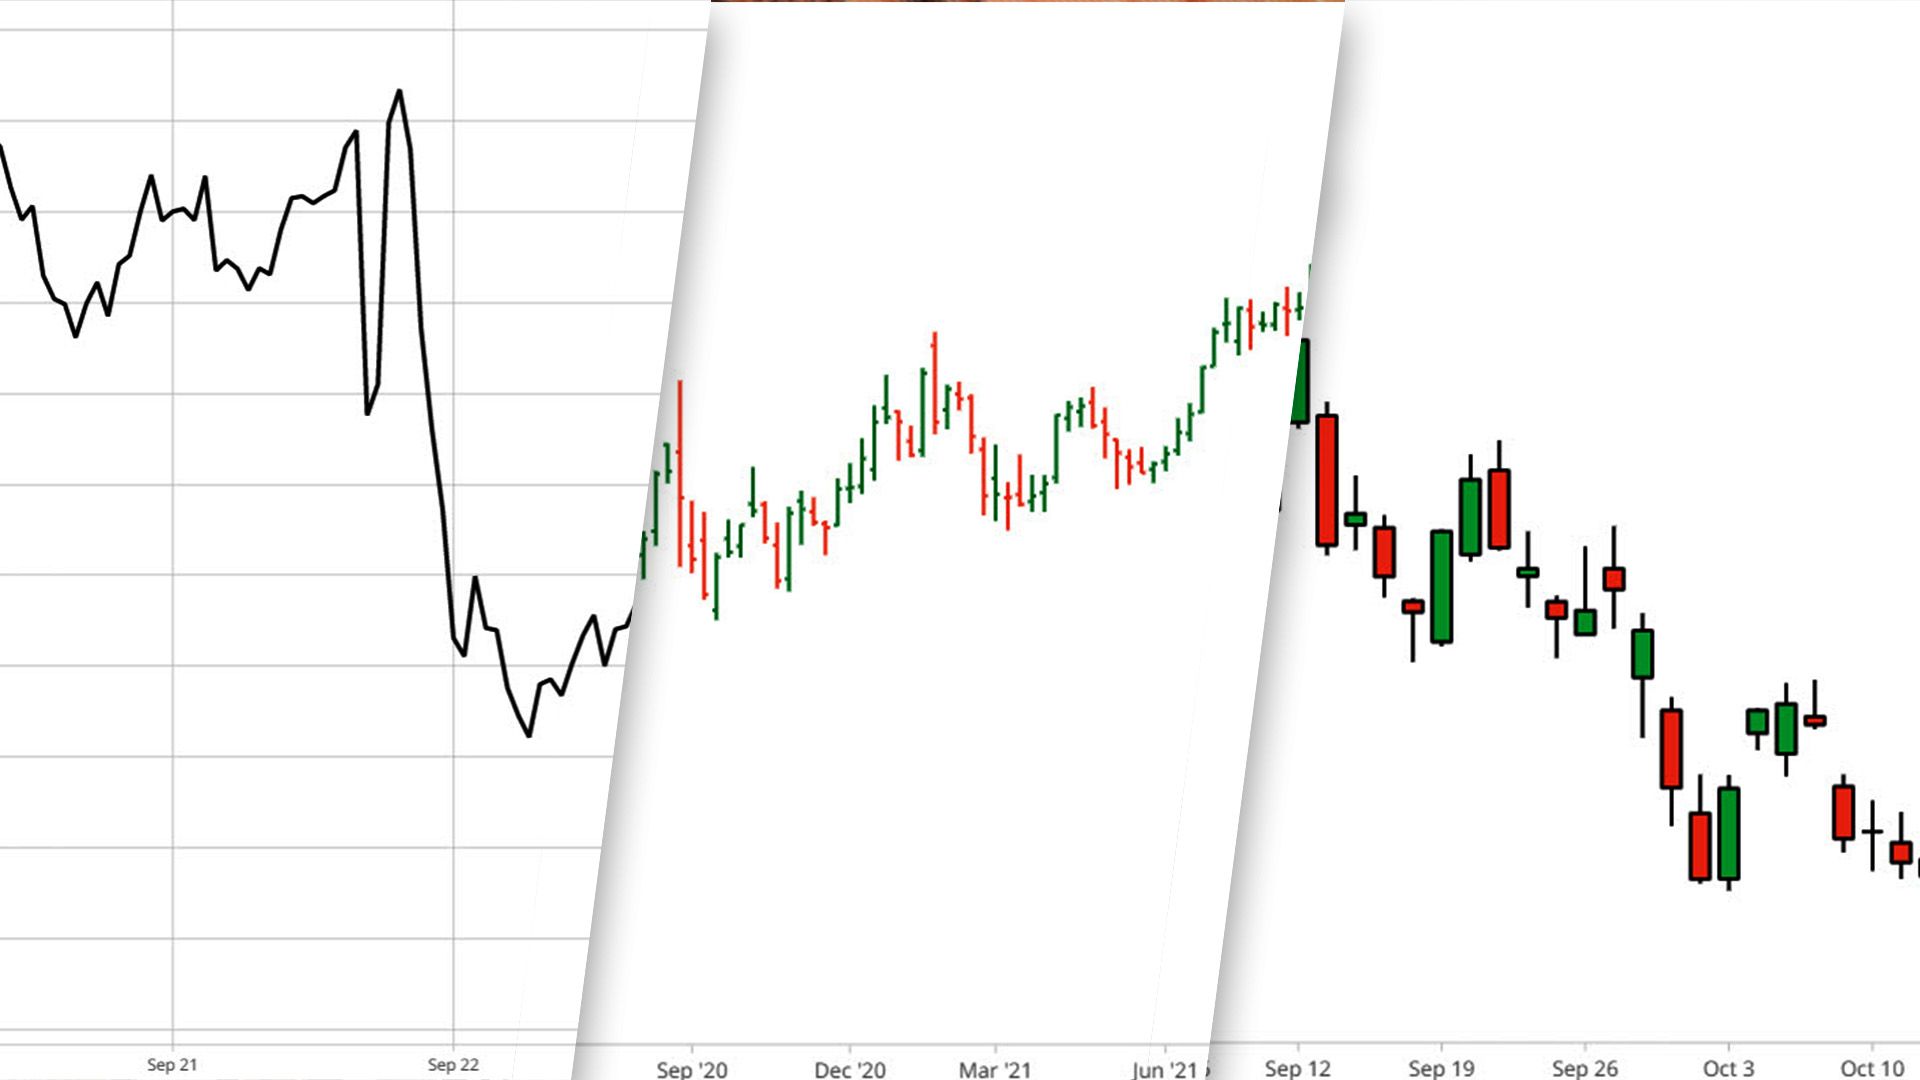
Types of Charts
Candlestick Charts
Candlestick charts plot open, high, low, and close for each time interval, showing direction, range, and sentiment at a glance. The body shows where price opened and closed, while the wicks reveal intra-period extremes and volatility. Traders read candle patterns like doji, hammer, engulfing, and morning star to time entries, place stops, and spot potential reversals using price action and support and resistance. Combine candles with volume, moving averages, RSI, or MACD to confirm momentum or a breakout. Which candle setups do you watch on your intraday screens?
OHLC Charts
OHLC or bar charts use a vertical line for the price range and short ticks for open and close, giving the same four data points as candles but with a cleaner, less bold look. Day traders use bars to assess momentum between periods, spot rejection at highs or lows, and read successive bar patterns for continuation or exhaustion. Color coding and overlaying indicators such as VWAP or volume profile make bar charts powerful for intraday decision-making. Do you prefer bars when you want a compact, information-dense view of price action?
Line Charts
Line charts connect closing prices across intervals, filtering out intra-period noise so you see trend slope and key support and resistance levels more clearly. They help identify primary trend directions fast and simplify pivot and trendline drawing for swing entries or position sizing decisions. The trade-off is lost detail: no highs, lows, or intraday rejection, so line charts work best in combination with a more detailed view when you need precise entry and exit levels. When do you switch to a simple close-only view to clarify market direction?
Area Charts
Area charts are line charts with the space under the line shaded to emphasize the move and trend strength, and they provide quick visual cues in reports or dashboards. Traders use them to show net trend bias in presentations or to highlight cumulative moves during a session, but they give little microstructure for scalping or tight mean reversion setups. Use an area chart to communicate direction, then flip to candles or bars for tactical executions — which presentation style fits your trading journal?
Heikin Ashi Charts
Heikin Ashi transforms raw OHLC into averaged bars, making trends look smoother and reducing false reversals. The standard formulas are: HA close = (open + high + low + close) / 4, HA open = (prior HA open + prior HA close) / 2, HA high = max(high, HA open, HA close), and HA low = min(low, HA open, HA close). Traders use Heikin Ashi to capture extended moves, stay with trends, and size targets with fewer whipsaws. However, remember that the smoothing introduces lag, so use support and resistance, volume, or a faster timeframe to refine entries. How often do you layer Heikin Ashi with conventional candlesticks to balance signals?
Time Frames in Trading Charts
Time frame selection governs signal frequency, stop placement, and risk per trade; standard intraday windows include 1 minute, 5 minute, 15 minute, 30 minute and 60 minute, while 4-hour and daily charts set the higher timeframe context. Day traders often run a multi-timeframe workflow, such as a higher timeframe for trend and significant support and resistance, a session timeframe for structure, and a lower timeframe for execution and precise entries.
Different markets suit different frames. Forex traders sometimes favor an 8-hour chart for swing bias, while scalpers use tick charts or 1-minute charts for order flow and rapid entries. Which time frame combination gives you clear trade setups and manageable risk?
Related Reading
- How Much Can You Make Day Trading With $1,000
- Day Trading Indices
- What is Liquidity in Day Trading
- Can You Start Day Trading With $100
- Day Trading as a Career
- Why is Pattern Day Trading Illegal
- Are Day Trading Courses Worth It
- Best Brokerage for Day Trading
- Best Cryptos for Day Trading
- What is Day Trading Buying Power
- Best Time Frame for Day Trading
Important Technical Analysis Terminologies You Should Know

ATR
Average True Range shows how much the price moves on average over a set period. Traders calculate the true range for each bar and smooth it to get ATR. Use it to set stop loss distance, choose position size, or place trailing stops so normal noise does not stop you out. In day trading, you can apply ATR to one-minute, five-minute, or daily charts to match your timeframe. Combine ATR with volume and momentum to judge whether a move has real force or is just noise. What ATR multiple will you use for your stop on your next trade?
Breakout
A breakout occurs when the price moves beyond a clear support or resistance level with increased volume. Breakouts signal the start of a trend or a strong directional move, but they also produce many false alarms. Look for confirmation, like a retest of the broken level, rising volume, or momentum indicator confirmation, before entering. Use stop losses below the breakout level or beyond a recent swing low, and size the trade to your risk rules. Will you enter on the first break or wait for a clean retest?
Cycle
Cycles describe recurring timing patterns in price action. Traders track intraday cycles, swing cycles, and seasonal effects to align entries with probable turning points. Tools like moving averages, oscillators, and time-based charts help reveal cycle length and phase. Combine cycle analysis with market structure and volume to identify high-probability windows for entries and exits. Which cycle length fits your trading timeframe and edge?
Dead Cat Bounce
A dead cat bounce is a brief recovery inside a larger downtrend that traps buyers. The bounce often comes on weak volume and fails to break meaningful resistance or trendline levels. To trade it, watch for failed rallies, bearish continuation patterns, and momentum divergence. Keep stops tight and use size discipline because these moves can reverse quickly. How will you protect yourself if the bounce reverses fast?
Dow Theory
Dow Theory uses the action of two broad averages to confirm trend direction and market health. When both major index groups trend together, the move gains credibility. Traders use this idea to bias intraday and swing positions by watching index correlation, sector strength, and breadth indicators. Use confirmation across related instruments before committing a large size. Which index signals will you follow to set your market bias?
Doji
A Doji forms when the open and close are nearly equal, indicating indecision between buyers and sellers. In isolation, a Doji says little; its value comes from context. After a strong trend, a Doji can warn of stalled momentum, but you want a confirming candle or volume change before acting. Combine Doji patterns with support, resistance, and order flow to sharpen entry timing. Will you wait for confirmation or trade off the Doji with a tight stop?
Elliott Wave
Elliott Wave describes price structure as alternating impulse and corrective waves, often in a five-up-three-down rhythm. Traders use wave counts with Fibonacci ratios to estimate targets and extension levels. Wave analysis requires practice and disciplined rules because counts change as new price data arrives. Use wave work as one input among momentum, volume, and market structure signals. How will you validate a wave count before risking capital?
Fibonacci Ratios
Fibonacci retracement and extension levels mark likely pause and reversal zones based on prior swings. Common levels include 38.2 percent, 50 percent, and 61.8 percent for retracements, plus 161.8 percent and 261.8 percent for extensions. Traders look for confluence where Fibonacci levels meet trendlines, moving averages, or horizontal support and resistance. Use these levels to place limit entries, stop losses, and profit targets. Which Fibonacci levels align with your following setup?
Harmonics
Harmonic patterns like Gartley, Bat, and Crab rely on precise Fibonacci leg ratios to define reversal zones. These patterns demand strict entry and invalidation rules and reward traders who wait for the setup to complete. Harmonic setups often include a tight stop beyond the pattern invalidation and a measured target based on pattern geometry. Backtest each pattern on your timeframe to see how they perform with your trade plan. What pattern rules will you code into your scanner?
Momentum
Momentum measures the rate of price change and helps separate strong trends from weak rallies. Use indicators like RSI, MACD, and rate of change alongside price structure to spot accelerations, decelerations, and divergences. Momentum divergence can warn of exhaustion before a reversal, while rising momentum supports trend continuation. Apply momentum to confirm breakouts and filter trades during low volatility periods. Which momentum signals do you trust for entry confirmation?
Price Action
Price action focuses on raw chart behavior: swing highs and lows, trendlines, candlestick patterns, and volume. It highlights market structure and order flow without cluttering the screen with lagging indicators. Traders who master price action learn to read entries, exits, and risk points from the chart itself and from tape reading when available. Pair price action with a clear trade plan and strict risk rules to stay objective. How will you practice reading pure price on small timeframes?
Resistance
Resistance marks levels where sellers previously overwhelmed buyers and prices stalled. Identify resistance with prior highs, consolidation zones, trendlines, and moving average clusters. When price approaches resistance, watch volume and momentum for signs of a break or a rejection. Trading strategies include fading the rejection, buying a confirmed breakout, or waiting for a retest as an entry. Which method fits your risk tolerance and time horizon?
Retracement
Retracements are temporary counter-trend moves that return the price to key support or resistance before the primary trend resumes. They differ from reversals because they respect the larger trend structure. Use moving averages, Fibonacci retracements, and momentum to spot likely pullback depth and timing. Entering on a shallow retracement in a strong trend gives a favorable risk reward, but confirm strength with volume or momentum. How deep will you let a pullback go before you give up on the trend?
Support
Support is the mirror of resistance. It is a price area where buyers have stepped in and halted prior declines. Find support using previous lows, consolidation zones, moving averages, and rising trendlines. A bounce at support yields long entries; a break below suggests a trend shift and can create short opportunities. Adjust stops to volatility and use position sizing rules to limit damage on false bounces. Where will you place your stop when trading a support bounce?
Trend
Trend is the persistent direction of price over time. Identify trends with higher highs and higher lows for uptrends, and lower highs and lower lows for downtrends. Moving averages, trendlines, and ADX help quantify trend strength. In trending markets, use trend following tactics like pullback entries and momentum confirmation; in ranging markets, prefer mean reversion and range strategies. Align your timeframes with the prevailing trend to maximize your trade horizon and gain a better edge. Which trend filters will you apply before pulling the trigger?
Get 25-30% off Today - Sign up to Get Access to up to $800 today.
Goat Funded Trader gives you access to simulated accounts up to $800K with industry-leading conditions. There are no minimum targets and no time limits, so you can focus on building a repeatable edge. Paydays come three times a month with up to a 100 percent profit split. Over 98,000 traders have collected more than $9.1 million in rewards, and payouts follow a two-day payment guarantee backed by a five-hundred-dollar penalty for delays. Choose customizable challenge paths or start trading immediately with instant funding. Sign up to get access to up to $800K today and receive 25 to 30 percent off.
Using Funded Accounts to Build a Technical Edge for Day Trading
How do you turn funding into consistent performance? Treat these simulated accounts like live capital and use them to refine price action, chart pattern recognition, and execution under pressure. Run the identical setups you plan to trade with real money, test entries and exits across multiple timeframes, and confirm signals with volume analysis, indicators, and order flow. Track expectancy, win rate, and average risk reward so you can scale position sizing with confidence.
How Goat Funded Trader Fits Into Your Trading Career
Use the challenge path to practice risk control and verification of your edge. Use instant funding when you have proven a strategy and want to scale live fast. The two-day payment guarantee with the five-hundred-dollar penalty shows a commitment to reliable payouts. Maintain a clear plan for scaling from small to larger position sizes as you validate your edge on funded capital. Which account size will push your development without overleveraging your psychology?
Related Reading
- Best Rsi Settings for Day Trading
- Best Moving Average for Day Trading
- Day Trading Checklist
- Best Markets for Day Trading
- Day Trading Indicators
- Stocks for Day Trading
- Day Trading Books
- Best Tools for Day Trading
- Day Trading Rules
- Day Trader Salary
- Best Day Trading Stocks
- How to Day Trade for a Living
- Day Trading Patterns
- Best Stocks to Day Trade
- Is Day Trading Legal
Be Great and get the App


.webp)


