


What is the Hanging Man Candlestick Pattern? A Detailed Guide
The Hanging Man Candlestick pattern guide offers clear steps to spot reversals and manage risk. Trade confidently with Goat Funded Trader’s expert tips.
.png)
Traders rely on candlestick patterns such as the Hanging Man to signal potential reversals in strong uptrends. A long lower shadow paired with a small body near the peak indicates that buying pressure may be declining, which can be critical for timing exits or short entries. Some traders ask, what is a funded account?
Access to extra trading capital transforms technical insights into strategic market moves without risking personal funds. Recognizing bearish signals through clear pattern identification supports disciplined risk management and agile decision-making. Goat Funded Trader’s prop firm provides access to funding and tools that help convert analysis into effective trading performance.
Summary
- The Hanging Man warns of exhaustion when it appears after sustained rallies, showing buyers struggled to maintain control despite closing near session highs. You'll recognize it by its small body positioned near the top of the candle and a lower shadow at least twice the body's length. That extended wick reveals intense intraday selling pressure that buyers barely managed to overcome, signaling potential momentum shifts at trend peaks. Without proper confirmation from the next session's price action, the pattern remains ambiguous and often leads to premature entries that get stopped out when rallies resume.
- Body color adds nuance but doesn't override the pattern's core message. Red Hanging Man candles show a 60% success rate when confirmed by subsequent bearish price action, while green versions maintain a 59% success rate regardless of the bullish close. The length of the lower shadow matters more than the candle's shadow because it quantifies the intensity of selling pressure buyers had to overcome. Volume separates conviction from noise, with patterns formed during heavy trading carrying significantly more predictive weight than those appearing during thin liquidity conditions.
- Confirmation transforms possibility into probability. The pattern gains credibility when the next candle closes below the Hanging Man's body, especially on rising volume, proving sellers maintained control beyond the initial warning shot. Conservative traders wait for this validation before entering, sacrificing early positioning for higher-probability setups that align with market direction rather than anticipation. Aggressive traders might enter when prices break below the Hanging Man's low, but this approach demands tighter stops and higher tolerance for occasional invalidations in exchange for better entry levels.
- Context determines whether the signal matters. A Hanging Man at a major resistance level, a Fibonacci retracement zone, or a well-tested moving average carries more significance than one appearing in open price space with no historical relevance. Markets remember price levels where supply and demand previously clashed, creating invisible barriers that influence future behavior. When multiple technical factors converge, the pattern strengthens. In isolation, it deserves skepticism and additional confirmation before committing capital.
- Position sizing based on stop distance rather than account balance anxiety separates disciplined execution from emotional trading. Most traders working with personal capital face brutal tradeoffs when high-probability setups appear, forced to choose between risking enough to make the trade worthwhile or protecting limited funds from a single invalidation. Scaling into positions on confirmation reduces average entry risk while maintaining exposure to full moves if reversals accelerate, acknowledging that patterns exist on a spectrum of reliability rather than as binary signals.
- Goat Funded Trader addresses this by providing simulated accounts up to $800K with daily drawdown limits of 2% to 5% that force traders to size positions based on stop distance instead of capital constraints, allowing proper risk-to-reward execution on confirmed Hanging Man setups without the cramped position sizing that comes from protecting personal savings.
What is the Hanging Man Candlestick Pattern, and How Do I Identify It?

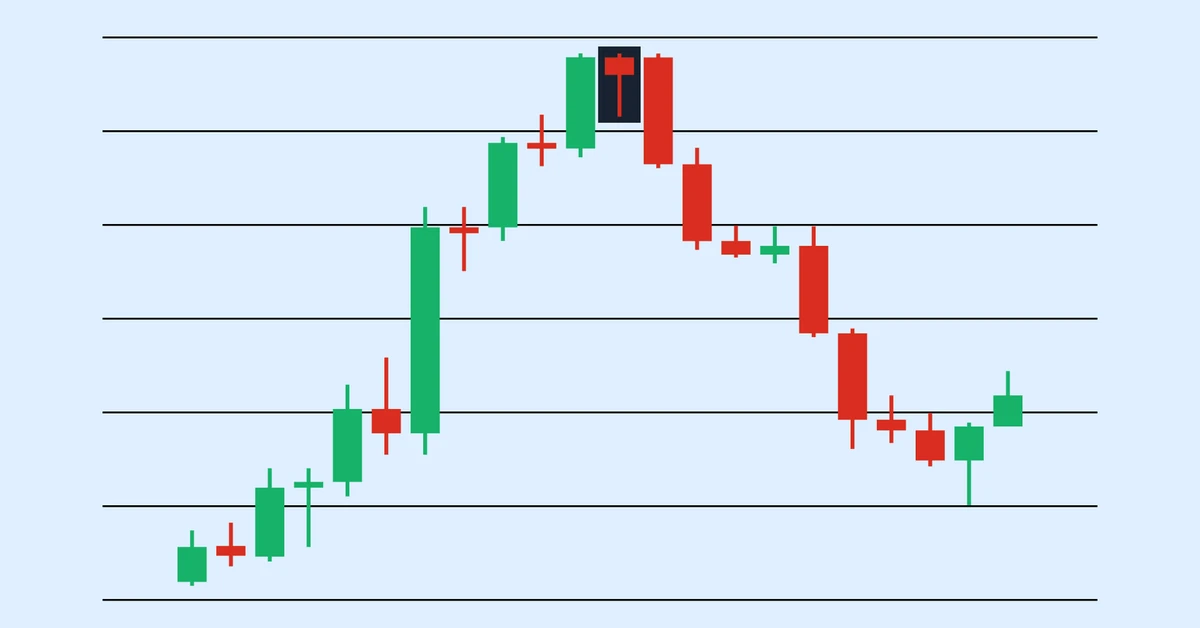
The Hanging Man appears when an uptrend starts to lose strength. You can identify it by its small body near the top of the candle, with a long lower shadow that is at least twice the body's length and little to no upper wick. This pattern shows that sellers pushed prices down sharply during the session, but buyers recovered most of the lost ground before the close, leaving a noticeable long tail. When this pattern appears after a strong rally, it's a warning that the balance of power may be changing. If you're trading with a prop firm, ensure you recognize these patterns effectively to make better decisions.
The lower wick tells the real story behind the movement. The lower shadow should be at least 2 times the length of the real body. This ratio is important because it measures the strength of selling pressure during the day. When prices drop significantly below the opening level, it indicates that sellers have entered the market aggressively, not just with mild profit-taking. Although buyers pushed prices back up before the close, this recovery does not change what happened during the session. Such a recovery takes effort, and that effort shows exhaustion. The longer the shadow extends, the stronger the rejection of higher prices becomes. This rising rejection suggests that the next session may confirm what the Hanging Man indicates: the rally is running out of steam.
Hanging Men can appear on any timeframe, from five-minute charts to weekly candles, but the context is important in deciding whether the signal is strong. On a daily chart, the pattern following a three-week climb is significant. On the other hand, on a one-minute chart during choppy midday trading, it often means just noise. The pattern requires a clear uptrend to signal a reversal, and that uptrend should show solid momentum rather than just a short bounce. Without this context, the Hanging Man loses its predictive ability.
How to analyze the Hanging Man's color?
Traders often focus on whether the body is bullish or bearish, but the power of the Hanging Man comes from its structure, not its color. A green body indicates the session closed higher than it opened, while a red body indicates it closed lower than it opened. Regardless of color, the long lower shadow indicates the same tension between buyers and sellers. The size and placement of the body are more important than its color. If the body is near the top of the candle's range, the pattern is valid. However, if the body grows larger or shifts toward the center, the signal becomes weaker. This means buyers had greater control throughout the session, not just at the end.
Why is the failure of buyers significant?
What you're really watching for is when buyers fail to sustain the rally. After weeks of prices closing higher, a Hanging Man pattern indicates sellers are putting up a strong fight. Prices fell significantly, which alarmed some participants. Although buyers bounced back, they didn't push prices to new highs. This slowdown is an important signal. The pattern doesn't guarantee that prices will reverse, but it changes the odds. Traders begin to doubt the uptrend will continue and wonder whether there is still support.
What confirms the Hanging Man pattern?
The Hanging Man becomes important when the next candle supports the reversal. If the next session closes below the Hanging Man's body, especially below its low, the pattern becomes more believable. This confirmation indicates that sellers have maintained control despite the initial warning sign. Without this confirmation, the Hanging Man could simply be a short-term scare, serving as a single-session profit-taking before another rally begins. So, confirmation turns possibility into likelihood.
How does volume affect the Hanging Man?
Volume adds another layer of validation to technical patterns. A Hanging Man that forms on heavy volume carries more weight than one that appears during light trading. High volume means that more participants agreed with the price action, making the rejection of higher levels more important. In contrast, a low volume suggests the move may lack strong support, making the pattern less reliable. Traders should look for agreement across different indicators, not just the shape of a single candle.
What are the common mistakes traders make?
Most traders who rely only on their own money face a tough limit; they can only risk what they’ve saved. This limit makes it hard to decide when a favorable opportunity arises, such as a confirmed Hanging Man. Should they take a big position to make the trade worth it, knowing that one loss could set them back weeks? Or should they trade small and see the pattern work out as expected, but lose out on bigger profits? Prop firms like Goat Funded Trader help eliminate that limit by providing synthetic capital that grows with performance. When traders spot a Hanging Man on a major currency pair after a long rally, they can make the reversal trade with the right position size instead of the tight risk management that comes with trading a small personal account. The pattern's advantage remains the same, but the ability to leverage it improves significantly.
How to avoid misinterpretation of the Hanging Man?
The most common mistake is seeing a Hanging Man on its own and treating it as a standalone signal. It's important to have a prior uptrend to interpret the current trend correctly. Without that background, you are just looking at a candle with a long lower shadow, which could occur for many reasons unrelated to trend exhaustion. The second mistake is failing to pay attention to the subsequent price action. A Hanging Man without confirmation raises doubts instead of giving clear answers. Traders who sell short immediately after this pattern forms often get stopped out when the price rallies one last time before dropping.
Why is market context important for the Hanging Man?
Another blind spot is failing to consider where the pattern fits within the broader market structure. A Hanging Man near a major resistance level or a round number is more important than one that appears in the middle of open price space. Support and resistance zones gather supply and demand, so a reversal pattern that matches those levels is more likely to be followed through. If you see a Hanging Man at a spot where several technical factors come together, the signal is stronger. If it appears alone, review it carefully and with skepticism.
What should you consider for risk management?
Risk management remains crucial, even after identifying a textbook pattern. The Hanging Man shows a possible reversal, but it does not rule out the chance of an uptrend continuing. A stop loss is necessary and should be placed just above the Hanging Man's high. If prices rise above that level, the pattern may have failed, and the original trend is likely still in place. Also, position sizing should depend on the distance to your stop and not on your confidence in the setup. Being too confident in any single pattern, no matter how clear it seems, can lead to big losses when the market does not act as you expect.
What does the Hanging Man indicate?
But here's the part that catches even experienced traders off guard: the Hanging Man's appearance doesn't tell you why the reversal might happen, only that conditions are shifting.
Related Reading
- What Is a Funded Account
- What Is A Prop Firm Account
- What is Scalping in Trading
- Perpetual Futures Example
- Cfd Leverage
- What is Arbitrage Trading
- Prop Firm Regulation
- How To Read Candlesticks
- What Is Drawdown In Trading
- What Is Fomo In Trading
- What Is Tp In Trading
- Mt4 Vs Mt5
- One Step Prop Firm Challenge
- Instant Funding Rules
Does the Color of the Hanging Man Candlestick Matter?

The body's color adds nuance but doesn't change the pattern's main message. Whether the candle closes green or red, the long lower shadow still shows the same fight between buyers and sellers during the day. The real question isn't about the color that appeared, but whether that color changes the likelihood of what will happen next. A red Hanging Man closes below where it opened, showing that sellers were in control until the end of the session. Buyers tried to rebound from the day's low, but they couldn't push prices back above the opening level. This failure is important. Red Hanging Man patterns have a 60% success rate when confirmed by subsequent bearish price action.
Although the color doesn't cause the reversal, it suggests sellers maintained enough pressure to prevent a bullish close, which often leads to further downward movement. You will often see red Hanging Men after long rallies, when momentum has already begun to weaken. The pattern shows when profit-taking accelerates and new buyers are unsure. If the next session starts lower and continues to decline, the red body’s signal becomes stronger. However, if prices open higher and go up, the pattern fails, and the color doesn't matter. Ultimately, context determines whether the color matters. If you're considering trading with prop firms, you might explore how these opportunities can enhance your trading strategies.
What does a green Hanging Man indicate?
A green Hanging Man closes above its open, indicating that buyers regained control before the session ended. This sounds good until you think about what happened during the day. Prices still dropped enough to create a long lower shadow, indicating that sellers aggressively challenged buyers. The green close indicates buyers won the session, but the shadow indicates they had to work for it. Research from Strike Money indicates a 59% success rate for bearish hanging man patterns, regardless of body color, when traders wait for confirmation.
The green version often confuses newer traders because the color conflicts with the pattern's bearish meaning. It appears to be a bullish candle, which may suggest strength, but the structure suggests otherwise. The lower wick shows some vulnerability. If the uptrend were really healthy, prices wouldn't have fallen that much during the day. The recovery suggests buyers still have some leverage, but the initial drop indicates their grip is weakening. Without confirmation from the next session, the green Hanging Man stays ambiguous.
How does volume affect the Hanging Man pattern?
Color provides context, but volume and follow-through decide if the pattern works. A Hanging Man that forms on heavy volume is more important than one that appears during light trading, no matter if it closes red or green. High volume means that more participants agreed with the price action, making it harder to ignore the rejection of higher levels. If the next candle closes below the Hanging Man's low, especially on rising volume, the reversal gains credibility. At that point, color becomes less important.
What trade-offs do traders face with a Hanging Man?
Most traders with limited personal money face a tough choice when they see a Hanging Man pattern. They can either take a large position to make the reversal worthwhile, risking a significant portion of their account, or trade a smaller size and see the setup work out correctly, but with only a small profit. Prop firms like Goat Funded Trader address this issue by providing simulated capital that grows with performance. When a confirmed Hanging Man appears on a major index after a long rally, traders can take a short position with sound risk management, rather than small position sizes driven by trying to protect a limited account balance. The pattern's advantage remains solid, but the opportunity to profit from it increases significantly.
How does trend context change the Hanging Man's meaning?
The one scenario where color fundamentally changes meaning is when the Hanging Man appears in a downtrend rather than an uptrend. A green-bodied candle with a long lower shadow at the bottom of a decline isn't a Hanging Man anymore. It's a Hammer, a pattern that suggests a bullish reversal. The structure looks the same, but the trend context changes the interpretation. Sellers pushed prices lower during the session, but buyers came back strongly, closing near the high. That shift from selling pressure to buying strength hints at a potential bottom, not a top.
This is where traders who focus only on color make costly mistakes. They see a green candle with a long lower shadow and interpret it as bullish, regardless of whether it followed an uptrend or a downtrend. The pattern's name changes because its predictive value changes. A Hanging Man warns of exhaustion after a rally. A Hammer signals potential strength after a decline. Same shape, different context, opposite meanings. Color matters less than where the pattern forms and what happens next.
When should you trust or ignore the color?
Knowing when to trust color and when to ignore it requires more than pattern recognition. It requires a better understanding of market dynamics and the context in which those colors show up. For more insights, check out this resource.
How to Trade Using the Hanging Man Candlestick Pattern

Trading the Hanging Man isn't about spotting the pattern and immediately placing orders. It involves layering confirmation, doing volume analysis, and timing entries carefully to avoid false signals that can mislead impulsive traders. While the pattern suggests possible exhaustion, you need more evidence before committing capital. Each step in this process reduces the likelihood that a brief hesitation will be acted on rather than a genuine trend reversal.
What confirms the Hanging Man pattern?
The Hanging Man alone doesn't carry enough weight to justify a trade. Confirmation comes when the next candlestick closes below the Hanging Man's real body. This indicates that sellers have maintained control despite the initial warning. This is important because it helps distinguish real reversals from quick profit-taking events that soon return to the uptrend. Without this confirmation, there is a risk of betting on a single day's price movement. This often results in early entries that are stopped out when the rally resumes.
A bearish candle immediately after the Hanging Man strengthens the signal by clearly showing that the balance of power has shifted. Buyers had their chance to defend the rally, but they failed. This failure becomes important when prices fall below the Hanging Man's low, confirming that the intraday rejection was not just background noise. Traders who skip this step often end up whipsawed, where the pattern appears valid but the underlying trend does not change. Remember, waiting costs you nothing but patience and greatly increases the likelihood that your trade aligns with the real market direction. For more insights into effective trading strategies, see the waiting costs.
How does volume influence the Hanging Man pattern?
Volume separates conviction from indecision. When the Hanging Man appears during heavy trading, it indicates that many people are challenging the uptrend, making it harder to ignore the rejection of higher prices. According to Strike Money (2024), hanging man patterns accompanied by volume spikes have a 59% success rate when traders wait for confirmation. This advantage arises because increased participation reflects real commitment, not merely algorithmic movements or low liquidity, which can cause exaggerated changes.
Low volume weakens the pattern's trustworthiness. If few traders participated in the session, the long lower shadow might indicate temporary order imbalances rather than a real change in sentiment. Ideally, volume should rise during the Hanging Man itself or on the confirming candle, and preferably both. This combination indicates that the reversal is driven by genuine selling pressure, not just a few participants moving a thinly traded market. When volume confirms the structure, the pattern becomes more believable.
What are the different trading strategies for the Hanging Man?
Conservative traders only start trading after the next bar closes below the Hanging Man's body. This strategy ensures the signal has formed before risking capital, reducing the risk of false signals. By waiting for proof that the upward movement has stopped, conservative traders forgo early entry in favor of a better chance of success. Across many trades, this method is often more profitable than aiming for the exact top. The market values accuracy more than speed, and waiting for confirmation helps traders base their actions on facts rather than guesses.
Aggressive traders, on the other hand, might jump in when prices drop below the Hanging Man's low. They often set a tight protective stop just above the pattern's high. This way, they can catch early movements if the reversal accelerates, but it also carries a higher risk if the pattern doesn't work out. With this approach, traders may face more invalidations, so they need quick responses and should be comfortable with occasional losses to secure better entry points. Neither strategy is wrong, but they require different levels of risk tolerance and position sizes. It's important to understand which style aligns with your account size and emotional strength before setup.
How to manage risk and position sizing?
Most traders using their own money face a difficult tradeoff. If they make their position large enough to make a reversal worth it, a single failed pattern can wipe out days of gains. On the other hand, if they trade too small, they might watch the setup work out perfectly but earn only a little profit that doesn't justify their analysis effort. Prop firms like Goat Funded Trader remove that limit by providing simulated capital that increases with steady performance.
When a confirmed Hanging Man shows up on a major forex pair after a long rally, traders can take the short position with the right size. This method enables better risk management by avoiding the limited strategies that result from protecting a small account balance. The pattern’s edge stays the same; however, the ability to take advantage of it grows when capital isn't a limiting factor.
Where to place stops and targets?
Position your protective stop above the Hanging Man's high to protect against the chance that the uptrend keeps going, even with this warning. This level serves as a sensible limit; if it is exceeded, the bearish idea is canceled. It shows that buyers are still in control and that the pattern has not worked out. Finding the price at which your idea is proven wrong is how careful risk management works; you aren’t just hoping the stop doesn’t get triggered.
Set the stop slightly beyond the high, by a few ticks or pips, depending on the instrument. This accounts for small changes that don’t disrupt the pattern. Markets move up and down, and tight stops are often hit by normal volatility before the real move begins. Give the trade enough space to operate without exposing yourself to big losses. The distance from your entry to your stop decides your position size, not how confident you are in the setup. Overconfidence can hurt accounts quicker than bad patterns.
How to adjust targets during a trade?
Deciding where to exit requires identifying nearby support levels where prices have bounced back in the past, or using moving averages to gauge recent price trends. Fibonacci retracement tools can help predict likely reversal levels based on the extent of the price move. They give you structured guesses about how far the price might drop. These aren't promises; they indicate potential areas where buyers might step back in and halt the decline.
Targets should change as the trade develops. If the reversal accelerates and moves below the initial support level, trail your stop to secure profits while still giving the position room to grow. If prices get stuck near your target and show signs of holding steady, consider taking partial profits and managing the rest with a tighter stop. Sticking to fixed targets overlooks market signals, which often offer better insights than what you thought before the trade. The goal isn't to guess the exact bottom but to capture a fair share of the move while guarding against reversals that could work against you.
What is the importance of context in trading?
Even with perfect execution on entry, confirmation, and stops, the Hanging Man pattern is only as useful as the broader context in which it is analyzed.
Related Reading
- Pass Ftmo Challenge
- Prop Firms That Use Mt5
- Best Prop Firms For Forex
- Best Prop Firms In Uae
- Proprietary Trading Firms In India
- Best Prop Firms In Nigeria
- Halal Prop Firm
- Best Prop Firms In South Africa
- Best Prop Firms In Uganda
- Best Prop Firms For Futures Trading
- Best Prop Firms For Options Trading
- Best Prop Trading Firms Malaysia
- Prop Trading Firms Singapore
Tips for Placing Successful Trades Using the Hanging Man Candlestick Pattern

Successful trading with the Hanging Man requires more than just recognizing it. You need to use technical indicators, match your position size to risk parameters, and trade with the discipline that sets successful traders apart from those who chase every pattern they see. The difference between a winning setup and a costly mistake often depends on the filters applied before investing. The Relative Strength Index (RSI) above 70 tells you the market has gone too far, too fast, creating a situation where a Hanging Man's warning is more significant. When the RSI shows overbought readings and a Hanging Man appears, two separate signals point to the same result: exhaustion. This alignment is important because single patterns often fail, but having multiple indicators pointing in the same direction helps reduce confusion and improve the chances of success.
How does MACD enhance the analysis of a Hanging Man?
Moving Average Convergence Divergence (MACD) adds another layer of analysis by showing momentum shifts before they are clear in price action. A bearish MACD crossover near a Hanging Man pattern suggests upward momentum is slowing rather than merely pausing. It's like seeing an engine lose power while the car keeps moving forward. When the MACD histogram starts to shrink or becomes negative around the same time the Hanging Man appears, the chance of a real reversal goes up. These signals are not the same; they measure different parts of market behavior. When they match, the setup is much stronger.
What is the significance of moving averages with Hanging Man patterns?
Price rejection at major moving averages, like the 50-day or 200-day lines, creates natural resistance zones where Hanging Man patterns become important. Traders who follow these averages look for failures at these levels because they represent the collective memory of past price action. When a rally hits the 200-day average and forms a Hanging Man, it signals both technical resistance and pattern-based exhaustion occurring at the same level. This combination of factors does not guarantee success, but it does change the odds in your favor enough to make the risk worthwhile.
How do historical levels influence the Hanging Man's success?
Support and resistance levels shape the environment in which patterns can work well or not at all. A Hanging Man that appears at a known resistance area is more likely to predict a change than one that shows up in a place that doesn't have a history. Markets recall price levels, where supply and demand have fought before; these memories form invisible barriers that affect future actions. When your pattern matches a level that had stopped rallies before, you're trading with history, not going against it.
What role do Fibonacci levels play in Hanged Man setups?
Fibonacci retracement levels provide probabilistic zones where reversals tend to cluster. This is especially true at the 61.8% and 78.6% levels, which indicate important retracements of previous moves. When a Hanging Man shows up near one of these levels after a long rally, it gives the pattern more meaning. Observers are not just seeing a single session's struggle; they are watching a clash between upward momentum and a mathematically defined area where buyers usually lose control. These numbers are not random; they reflect crowd behavior patterns that occur often enough to be significant.
How do trendlines affect Hanging Man patterns?
Trendlines drawn from recent swing lows or highs provide dynamic support and resistance that changes as the market evolves. A Hanging Man that forms as prices test an ascending trendline from below shows a potential breakdown, especially if the volume confirms the rejection. Traders watch for the market's failure to keep the path it followed for weeks or months. This failure becomes tradeable when the pattern supports what the trendline already indicated. Structure gives the pattern meaning; without it, you're trading shapes, not setups.
What challenges do traders face with Hanging Man setups?
Most traders using personal capital face a difficult choice when they see a confirmed Hanging Man setup. They must risk enough to make the trade worthwhile; however, a single wrong move can significantly harm their account. If they trade too conservatively, even with perfect execution, they might realize very small returns that don't justify the analysis. This situation leads to compromises that weaken their advantage over time, changing high-probability setups into marginal opportunities. Ultimately, the amount of capital available determines how large their position can be, rather than the quality of the setup.
How do prop firms assist traders with risk management?
Prop firms solve this problem by distributing simulated money with safety rules modeled on those used by large institutions. Goat Funded Trader sets up challenges with daily loss limits of 2% to 5% and total limits of 4% to 10%. This setup encourages traders to choose trade sizes based on how far they set their stops, rather than worrying about their account balance. For example, when a trader sees a Hanging Man pattern on EUR/USD after a three-week increase, they can enter trades with appropriate risk-to-reward ratios. This method offers more opportunities to capitalize on patterns because the drawdown rules promote discipline over fear, thereby improving trading decisions.
What is the impact of trading rules on behavior?
Trading rules are critical for preventing overtrading, which can harm accounts, especially during losing streaks. When traders reach a daily loss limit, the system prevents them from getting into revenge trading. This is when they try to catch setups that look good but lack sufficient confirmation or supporting factors to distinguish winners from losers. These rules act like a safety measure, protecting traders from their worst instincts when patterns don’t work and emotions run high. Traders work within set guidelines rather than relying solely on their own judgment.
How to enter a trade effectively after identifying a Hanging Man?
Entering a full position immediately after the Hanging Man appears can expose traders to the highest risk if the pattern fails before confirmation. Instead, breaking the entry into two or three parts helps traders assess the setup with lower risk, increasing their position only after the next candle confirms the reversal. The first part should be placed at the low of the Hanging Man, the second after the confirming candle closes below the body, and the third if prices go below nearby support. This method reduces average entry risk while maintaining the opportunity to benefit from the full move if the reversal accelerates.
What advantages does scaling provide in trading?
Scaling offers flexibility to adjust when market conditions change. If the first tranche is stopped out before confirmation, traders can avoid being fully exposed to a failed pattern. When confirmation arrives, but momentum slows, holding a partial position avoids the regret of being fully committed to a setup that delivers only part of the expected outcome. This strategy recognizes that patterns exist across a range of reliability, rather than as binary signals that work or do not. Consider how joining a prop firm can help you implement these strategies more effectively.
How to manage profits after a favorable move?
Once the trade moves in your favor and breaks through initial support levels, trailing your stop locks in gains while giving the position space to continue. Move the stop to breakeven after prices drop below the first support zone; this action removes the risk of turning a winner into a loser if the market reverses. As the decline continues, adjust the stop to follow price action; consider using the most recent swing high as the reference point. This approach allows profits to grow while protecting against significant losses if buyers return.
Why is trailing stop-loss better than fixed profit targets?
The trailing stop eliminates the need to guess exact profit targets, which often prove inaccurate when markets move beyond expectations. Instead of trying to determine where the reversal ends, traders let price action show when the move has run its course. When prices finally rise back above the trailing stop, the exit occurs at whatever the market offers, not based on the desired price. This flexibility captures outsized moves as they occur, helping to avoid the stress of holding on during reversals that could wipe out gains.
What is the ultimate key to success with trading patterns?
Even the best risk management strategies and indicator combinations don't work well if a trader looks only at a pattern without considering the broader risk that makes it valuable.
Get 25-30% off Today - Sign up to Get Access to Up to $800K Today
Spotting a Hanging Man after a long rally is one thing. Having enough money to act on it with the right position size is another challenge. When trading personal funds, every time a reversal setup occurs, you have to choose between risking enough to make the trade worthwhile and protecting your account from a mistake that could set back your progress by weeks. This pressure doesn't come from a lack of skill; it arises because using personal capital imposes a limit that isn’t tied to how well you read price action.
Goat Funded Trader removes that limit by offering simulated accounts up to $800K. This allows you to execute confirmed Hanging Man setups with institutional position sizes, rather than the tight risk management required when protecting limited funds. Traders can choose evaluation challenges to prove their pattern recognition skills or jump straight into instant funding options to start trading right away. Over 98,000 traders have already earned more than $9.1 million in rewards, with a 2-day payment guarantee and a $500 penalty for late payments. As you grow through consistent performance, profit splits can reach 100%, providing a support system that rewards discipline over luck. Ready to trade Hanging Man reversals with real capital behind you? Sign up today to get 25-30% off your challenge or funding option and access up to $800K in simulated capital.
Related Reading
- Surgetrader Vs Ftmo
- Best Prop Trading Firms For Stocks
- Bulenox Vs Apex
- Prop Firms That Allow Ea
- Prop Firms In Ghana
- Take Profit Trader Vs Topstep
- Ftmo Vs Topstep
- Topstep Vs Apex
- My Forex Funds Vs Ftmo
- Prop Trading Firms Toronto
- Balance-Based Drawdown Prop Firms
Be Great and get the App


.webp)


