


How to Read Crypto Charts for Day Trading: 7 Simple Steps
Learn how to read crypto charts for day trading in 7 steps. Goat Funded Trader breaks down patterns, signals, and entries fast.
.png)
Reading a crypto chart for the first time can feel overwhelming, with price candles shifting unpredictably and trend lines crossing in seemingly random ways. Knowing how to interpret these signals accurately is what separates traders who react emotionally from those who act on data. Learning how to use AI for crypto trading adds another layer of precision, helping traders filter noise and identify high-probability setups faster.
Chart reading skills only create real results when paired with disciplined execution and proper risk management. Applying these techniques consistently becomes far more meaningful when actual capital is involved, which is why many traders choose to scale their strategies through a prop firm.
Table of Contents
- What Are Crypto Charts and Why Do Day Traders Use Them?
- Which Types of Crypto Charts Should Day Traders Use?
- How Accurate Are Crypto Chart Patterns?
- 7 Simple Steps to Read Crypto Charts for Day Trading
- Common Mistakes Day Traders Make When Reading Crypto Charts and How to Avoid Them
- How Goat Funded Trader Helps Traders Apply Their Chart Analysis Skills
- Get 25-30% off Today - Sign up to Get Access to up to $800K Today
Summary
- Chart patterns carry real statistical weight, but only when properly confirmed. According to the Bitcoin Foundation, patterns like head and shoulders resolve in the predicted direction roughly 83 percent of the time in traditional markets, but that figure drops significantly in crypto due to whale-driven liquidity shifts and 24/7 trading cycles. Volume confirmation is the critical filter, with breakouts backed by 25 to 30 percent volume surges carrying higher reliability than meaningfully unconfirmed formations.
- Multi-timeframe alignment is the step most retail traders skip, and it accounts for a large portion of failed setups. A bullish pattern on a 5-minute chart carries almost no standalone weight if the 4-hour chart is still trending downward. Traders who establish directional bias on higher timeframes before dropping to shorter ones for entries filter out an estimated 30 to 40 percent of setups that look correct but lack the broader context to follow through.
- Crypto markets operate 24 hours a day, 7 days a week, so price action continues across all time zones, weekends, and holidays without pause. This structure creates both opportunity and exposure that traditional market traders rarely face. A pattern forming at 2 a.m. carries the same technical weight as one forming during peak New York session volume, which places a higher demand on systematic chart reading rather than session-based intuition.
- Chart type selection is a decision most traders treat as a default rather than a deliberate choice, and that gap quietly undermines the quality of analysis. Heikin-Ashi charts smooth price action across trends but obscure exact entry levels, while Renko charts remove time entirely to reveal cleaner breakout structure in high-volatility assets. Each type serves a specific analytical purpose, and using the wrong one for the market condition introduces noise rather than clarity.
- Capital constraints distort chart-reading behavior in ways that compound over time. When account size limits a trader's ability to absorb normal drawdowns, the response is typically either to undersize positions until they become meaningless or to overcompensate with excessive risk. Both patterns erode the pattern-recognition confidence that took months to develop because premature exits and skipped setups reinforce the wrong lessons, regardless of how accurate the original analysis was.
- Strategy breadth directly affects how accurately traders read charts, because traders who only know one or two approaches tend to project that bias onto price action where it does not belong. A trader who exclusively trades breakouts will identify breakout setups in choppy, low-volume conditions where price is essentially noise. Expanding the strategy vocabulary across trending, ranging, and high-volatility market phases builds the contextual recognition needed to distinguish genuine signals from false ones.
- Goat Funded Trader addresses the capital constraint problem directly by giving traders access to up to $800,000 in funded accounts, creating an environment where multi-timeframe analysis and volume-confirmation skills can be applied at a meaningful size without personal financial exposure on every trade.
What Are Crypto Charts and Why Do Day Traders Use Them?
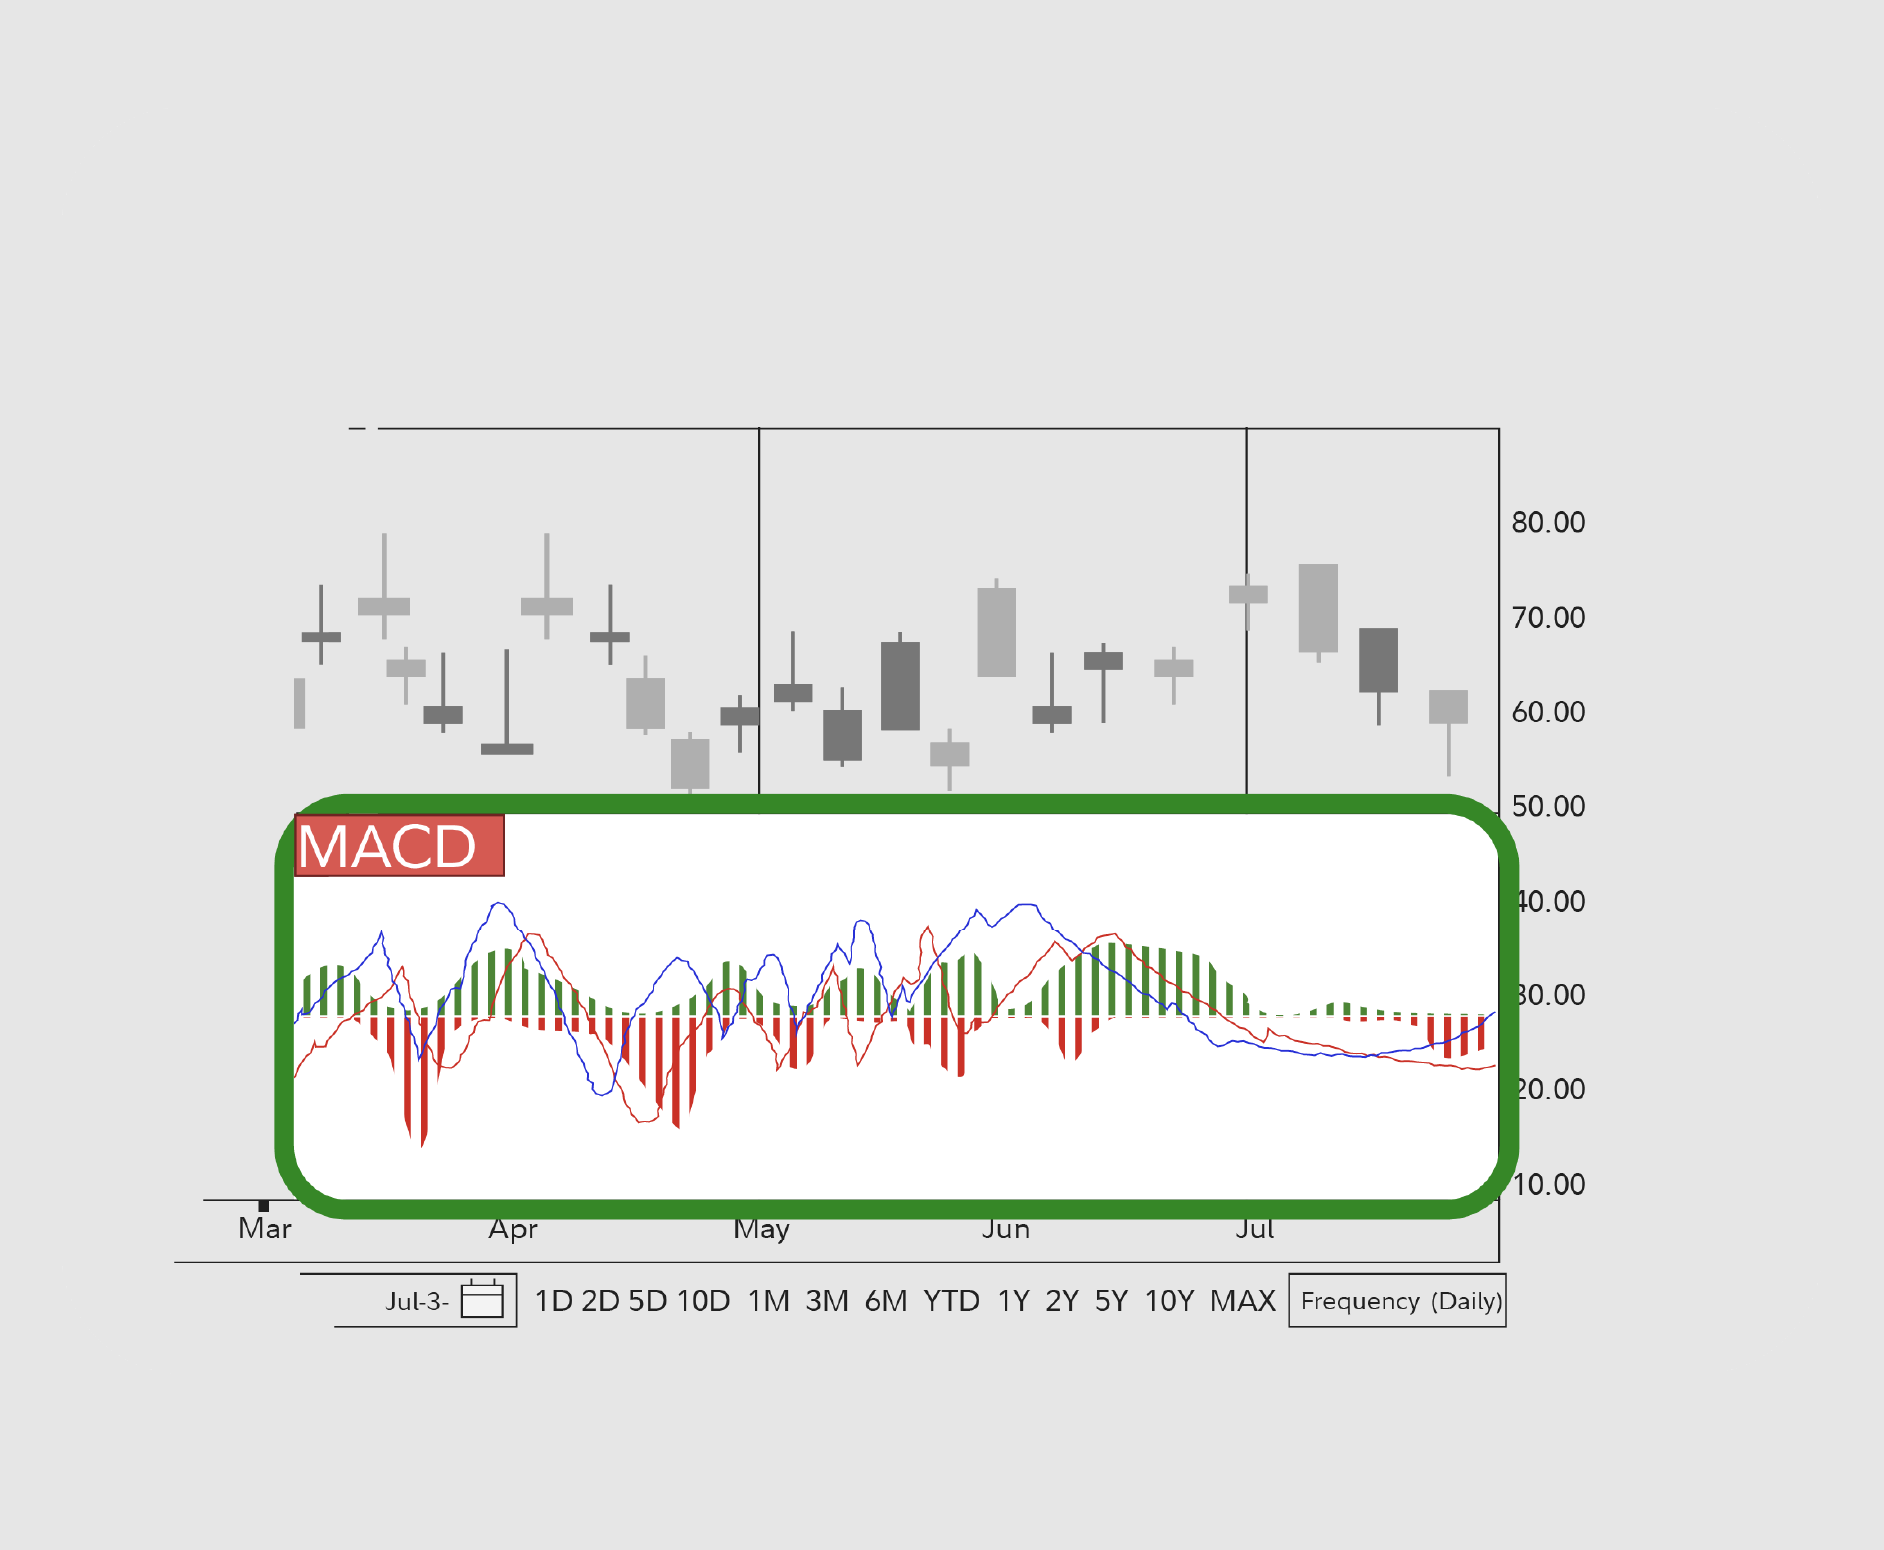
Crypto charts turn raw price data into signals you can read: candlestick formations showing battles between buyers and sellers, volume bars confirming how serious traders are, and indicators like RSI and MACD measuring momentum before it becomes clear. For day traders, charts are not optional — they are the foundation of every choice.
💡 Key Components: Crypto charts combine three core data layers — price action, volume, and momentum indicators — to give traders a complete picture of market conditions.
Here is a breakdown of what key chart components show and why they matter:
- Candlestick Formations: Illustrates the battles between buyers and sellers, revealing who is currently in control of the price.
- Volume Bars: Displays trader conviction and participation, confirming whether price moves are serious or weak.
- RSI & MACD: Highlights momentum before it becomes obvious, helping traders act early rather than late.
"For day traders, charts are not optional — they are the foundation of every choice."
Crypto markets operate 24/7 across every time zone and holiday. A pattern forming at 2 a.m. on Tuesday carries the same technical weight as one during peak New York session volume. The charts do not care what time it is, and neither does the market.
⚠️ Warning: Unlike stock markets that close at 4 p.m. EST, crypto never pauses. High-impact patterns can form while you sleep, and missing a signal can be costly.
🔑 Takeaway: Crypto chart literacy is essential around the clock. Traders who can read signals at any hour hold a critical edge.
How do support, resistance, and pattern scanning sharpen your edge?
Support and resistance levels show where the market has made decisions before, and those levels tend to matter again. A breakout above resistance on strong volume signals a shift in market control. Tools like altFINS, which scan 500 coins and flag 26 patterns in real time, let traders focus on execution rather than manual discovery.
How to read crypto charts for day trading across multiple timeframes?
The critical difference between skilled and casual chart readers is how they layer timeframes. A 5-minute bull flag becomes actionable only when the 1-hour chart confirms the broader trend is intact. Without alignment, the signal is noise. With it, the trade has structure: entry near support, stop below the pattern low, target at the next resistance zone. Most retail traders skip this step, entering on short timeframes without confirming the bigger picture, then wonder why setups fail.
How does chart literacy open access to capital for funded trading?
Being able to read charts opens doors beyond personal accounts. Prop firms like Goat Funded Trader evaluate traders on disciplined, structured approaches. Traders who demonstrate they can read market structure, manage risk relative to volatility, and execute with consistency earn access to funded capital through our platform. Not every chart type tells the same story, and choosing the wrong one for your trading style can undermine sharp analysis.
Related Reading
- How to Use AI for Crypto Trading
- What Are Crypto Trading Signals
- How Long Does It Take To Learn Forex Trading
- What Is Spot Trading in Crypto
- Is Paper Trading Real Money
- Emotional Trading Mistakes
- Common Mistakes in Stock Trading
- Crypto Trading Mistakes
- Forward Testing Trading
- Paper Trading Vs Live Trading
- Risk Reward Ratio Trading
Which Types of Crypto Charts Should Day Traders Use?
Candlestick charts are the foundation of serious day trading. According to the CAIA Blog's Crypto Chart Patterns guide, candlestick charts show four key pieces of information for each time period: open, high, low, and close prices. That single time period shows not just where the price ended up, but the entire struggle that happened along the way.
"Candlestick charts show four key pieces of information for each time period: open, high, low, and close prices — revealing not just the outcome, but the full price battle within that window." — CAIA Blog, 2025
🎯 Key Point: Candlestick charts are not just price trackers — they capture the full story of market pressure, momentum, and reversal within every single time period.
🔑 Takeaway: If you're day trading crypto, candlestick charts give you the most data-dense view available — making them the essential starting point for reading real-time market signals.
Here is a breakdown of what each chart element reveals about the market's action:
- Open Price: Shows where the battle began.
- High Price: Marks the peak of buying pressure.
- Low Price: Indicates the depth of selling pressure.
- Close Price: Reveals who won the period's struggle.
Why does time frame granularity matter when reading crypto charts for day trading?
Day traders commonly use time frames as short as 1-minute or 5-minute candlestick charts for intraday trading decisions. This detail matters because crypto moves fast: a 5-minute candlestick on Bitcoin during a news-driven spike can show a rejection wick that a line chart would hide, often making the difference between a good entry and a costly mistake.
When to reach for a different chart type
The failure point is usually rigidity. Traders who stick with one chart type regardless of market conditions force their analysis onto an unsuitable structure.
When does Heikin-Ashi help you read crypto charts for day trading?
Heikin-Ashi charts smooth price action using averaged values, making them useful for identifying and staying within trending moves on 15-minute or 1-hour timeframes. However, because they alter raw price data, they obscure exact entry levels and work best as a confirmation layer alongside standard candlesticks rather than as a standalone indicator.
When do Renko charts give you a cleaner view of breakout structure?
Renko charts remove time from the equation, plotting bricks only when the price moves a defined amount. For high-volatility assets like Ethereum or Solana, this strips away noise that clutters regular charts during consolidation and reveals a clean breakout structure. The trade-off: Renko charts lack session context, so pairing them with a time-based chart to determine execution timing is necessary.
Why does knowing which chart to use separate fundable traders from the rest?
Most traders stick with one chart type because learning a second feels like extra work. Traders seeking funding through evaluations at a prop firm are judged on whether their process is organized, repeatable, and grounded in solid technical reasoning. Knowing which chart to use and why is the professional skill that separates funded traders from those relying on gut feelings.
The multi-timeframe edge most traders skip
The most consistent day traders use multiple timeframes together. They establish directional bias on 4-hour or 1-hour charts, then drop to 5-minute or 15-minute candlesticks for precise entries. A bullish engulfing pattern on a 5-minute chart carries little weight on its own. Align that pattern with an uptrend on the hourly and a clean support level on the 4-hour, and probability shifts meaningfully in your favor. Chart type and timeframe are one decision made together. The real question is whether the patterns those charts reveal can be trusted.
How Accurate Are Crypto Chart Patterns?
Crypto chart patterns give traders real, measurable advantages, but not the kind most traders think they will get. They are tools based on probability, not things that predict the future for certain, and the difference between those two things is exactly where most trading accounts lose money.
"Chart patterns are probability tools, not crystal balls — the traders who treat them as guarantees are the ones who blow their accounts first."
💡 Tip: Before placing any trade based on a chart pattern, ask yourself: are you treating this as a probabilistic edge or a guaranteed outcome? That mindset shift alone can protect your capital.
⚠️ Warning: The most common mistake crypto traders make is confusing pattern recognition with certainty. No pattern — not a head and shoulders, not a bull flag, not a double bottom — has a 100% success rate. Trading them without a risk management plan is the real account killer.
Here is a breakdown of the different pattern types, the edge they provide, and what they do not do:
- Continuation Patterns: Signals probable trend continuation, but does not guarantee price follows through.
- Reversal Patterns: Flags potential trend exhaustion, but does not confirm exact reversal timing.
- Breakout Patterns: Identifies likely momentum shifts, but does not eliminate false breakout risk.
Does volume confirmation change how to read crypto charts for day trading?
The accuracy question comes down to one word: confirmation. According to the Bitcoin Foundation's 2026 crypto trading guide, chart patterns work 60 to 70 percent of the time when volume confirms them. Without volume confirmation, you trade what the market looks like rather than what drives it. A wedge pattern where volume jumps 25 to 30 percent on the breakout candle merits attention.
Why do textbook patterns fail differently in crypto markets?
Head-and-shoulders patterns resolve in the predicted direction roughly 83 percent of the time in traditional markets, but crypto's structural differences matter. Whale-driven liquidity shifts, 24/7 trading cycles, and sudden news catalysts can collapse a textbook formation mid-pattern. The market conditions required to complete the pattern may change before the price reaches it. Understanding this distinction matters more than memorizing the pattern itself.
How does confirmation-first thinking protect traders from false breakouts?
Most traders examine short-term charts, spot a familiar pattern, and enter quickly. The pattern looks clean, but false breakouts accumulate, small losses compound, and confidence erodes. Traders who use a prop firm like Goat Funded Trader work within structured evaluation frameworks that reward disciplined, confirmation-first thinking and link pattern literacy directly to funded capital.
What separates patterns that work from patterns that mislead?
The failure point is almost always multi-timeframe misalignment. A double bottom forming on a 15-minute chart means little if the 4-hour chart is still trending downward with no structural shift. Traders who layer support and resistance levels, trend direction across timeframes, and momentum indicators like RSI into their read of a formation filter out the 30 to 40 percent of setups that look right but are not. That filtering process is the skill separating traders who read charts from traders who trade charts.
How does confirmation discipline shape how to read crypto charts for day trading?
How accurate crypto chart analysis is depends on your discipline in confirming signals, your chosen timeframe, and whether you skip setups that don't fit your rules. Traders who understand this build real advantages over time.
Related Reading
- Crypto Trading For Beginners
- Fear Of Missing Out And Trading
- Discipline In Trading
- Common Forex Trading Mistakes Beginners
- Trading Risk Management 1% Rule Explained
- Risk Management Day Trading
- ICT Trading Strategy For Beginners Step By Step
- Trading Risk Management Strategies
- Algorithmic Trading Risk Management
7 Simple Steps to Read Crypto Charts for Day Trading
Reading crypto charts turns raw price data into visual trends, momentum, support and resistance levels, and high-probability trading opportunities. Mastering this essential skill lets you make decisions based on real market action rather than guesswork.
"Traders who rely on chart analysis are making decisions grounded in market structure — not emotion or speculation." — Trading Fundamentals
🎯 Key Point: Reading crypto charts is the single most important skill a day trader can develop — it separates informed decisions from costly guesses.
💡 Tip: Start by identifying three core elements on every chart: trend direction, support levels, and resistance levels — these form the foundation of every successful trade.
Here is a breakdown of what key chart elements tell you and why they matter:
- Visual Trends: Shows the direction of price movement, which identifies bullish or bearish momentum.
- Support Levels: Highlights the price floor where buying increases, signaling potential entry points.
- Resistance Levels: Marks the price ceiling where selling increases, signaling potential exit points.
- Momentum Indicators: Measures the speed and strength of price moves, which confirms trade timing.

Step 1: Select Your Charting Platform and Timeframes
Pick a reliable platform like TradingView that provides real-time data, customizable layouts, and advanced tools for crypto assets. Set up multiple timeframes: use 1-hour or 4-hour charts to determine the broader directional bias, then drop to 5-minute or 15-minute intervals for precise entry timing. This multi-timeframe approach prevents trading against the dominant trend and filters out false signals that are common in lower timeframes during choppy sessions.
Step 2: Master Candlestick Anatomy
Look at each candlestick to understand price action within its timeframe. The body shows the open-and-close range: green for bullish closes above the open, red for bearish closes below it. Wicks show high and low extremes, highlighting rejection zones where buyers or sellers stepped in aggressively. In day trading, focus on candle clusters on short timeframes to spot momentum shifts, and watch for long wicks, which can signal possible reversals at key levels.
Step 3: Determine the Overall Trend
Draw trend lines connecting higher lows in uptrends or lower highs in downtrends to identify the market's main direction. Uptrends show ascending peaks and troughs, downtrends show descending ones, and sideways markets display horizontal ranges. Day traders align their bias with the higher-timeframe trend, entering pullbacks in the direction of the flow rather than against it, which improves win rates on intraday setups.
Step 4: Identify Key Support and Resistance Levels
Mark horizontal support zones where price has repeatedly bounced and resistance areas where selling pressure has capped advances. These levels often align with round numbers, previous highs or lows, or moving average clusters. When price tests these zones again, strong bounces with increasing volume confirm their validity, while decisive breaks signal a possible trend change or continuation.
Step 5: Analyze Volume for Confirmation
Compare price moves with the volume bars at the bottom of the chart. When volume rises during breakouts or strong candles, it shows traders believe in the move. When volume declines during price increases, it warns that momentum is weakening and a reversal is likely. Day traders need above-average volume for entries to avoid getting trapped when few traders are active. They use volume spikes to confirm pattern completion or trend continuation.
Step 6: Apply Essential Technical Indicators
Add a few focused indicators without crowding the chart. Use simple moving averages (50- and 200-period) to identify dynamic support and momentum shifts. Add the Relative Strength Index (RSI) to spot overbought conditions above 70 or oversold below 30, and use MACD for divergence signals. These tools work together: price respecting a moving average near support with bullish RSI divergence creates high-probability setups.
Step 7: Recognize Patterns and Execute with Risk Rules
Look for reliable patterns, such as flags that signal the trend will continue or double bottoms that signal the trend will reverse, on your chosen timeframes. Confirm the pattern with volume and alignment with higher timeframes before entering a trade. Place stops just beyond the level where the pattern breaks, and target moves based on formation height. Risk no more than 1% of your capital per trade. Practice these steps daily on past price charts before trading with real money. Consistent practice builds the instinct needed to navigate crypto's fast movements with precision and discipline.
Common Mistakes Day Traders Make When Reading Crypto Charts and How to Avoid Them
Reading crypto charts is a skill that improves with practice, though even experienced traders make costly mistakes. A single error in chart analysis can lead to poor entries, unnecessary losses, missed opportunities, and emotional decision-making. Understanding common chart-reading mistakes helps traders avoid these pitfalls and develop a more disciplined approach to day trading.

Ignoring Higher Timeframes for Context
Many day traders focus only on 1-minute or 5-minute charts and miss the bigger trend on hourly or 4-hour views. This leads to fighting strong moves and entering setups that contradict the trend and fail quickly. Always start your analysis on higher timeframes to determine the market's direction, then zoom in to find entry points aligned with the dominant trend. This multi-timeframe confirmation filters out noise and improves trade quality.
Overloading Charts with Too Many Indicators
Traders fill their screens with dozens of indicators, creating analysis paralysis in which conflicting signals obscure clear price action. Use two or three complementary tools, such as a simple moving average for trend and RSI for momentum, and let raw price and volume drive most of your decisions. Clean charts provide faster, more reliable insights in time-sensitive crypto sessions.
Misinterpreting Candlestick Patterns Without Confirmation
Day traders often act on isolated candlestick formations, such as hammers or engulfing patterns, without volume support or level context, which can trigger false reversals and stops. In volatile crypto, single-candle signals frequently represent noise rather than conviction. Require confluence: strong volume on the candle, proximity to support or resistance, and alignment with the higher timeframe before acting. This filter transforms pattern reading from guesswork into high-probability setups.
Neglecting Volume and Its Role in Validation
Price moves without matching volume spikes; often, such moves reverse, yet many traders ignore the volume histogram and blindly chase momentum. Low-volume breakouts in crypto frequently trap participants before smart money exits. Demand elevated volume on decisive candles or breaks to confirm institutional participation, and compare it to recent averages for stronger conviction in intraday decisions.
Failing to Adapt to Changing Market Conditions
Traders often use the same chart templates regardless of market conditions—whether ranging, trending, or volatile. This leads to repeated failures when conditions change. Crypto markets flip quickly due to news or liquidations. Watch the bigger picture: overall volatility indexes and recent trading session behavior. Then adjust your timeframe, risk size, or focus patterns based on what you observe.
Poor Risk Management Tied to Chart Interpretation
Traders often set stop-losses based on recent price movements rather than logical chart structure, or risk too much on trades that might not work out, turning small mistakes into losses that threaten their entire account. Proper risk management starts with defining where a trade is invalid based on support, resistance, or pattern boundaries. Prop firms eliminate this capital risk entirely. Our Goat Funded Trader program offers up to $2 million in simulated capital with a 3% maximum daily loss and a 6% overall maximum loss, allowing traders to focus on reading charts without risking their own money. The platform features 80-100% profit splits, no time limits, news trading allowed, and rewards paid on demand or guaranteed within 24-48 hours.
Emotional Trading and Revenge Setups After Losses
When traders lose money on a trade, it clouds their judgment and often causes them to force the next trade to recover quickly, ignoring clear signals or risking too much on weak patterns. This emotional spiral can destroy accounts, especially in volatile crypto markets. The best way to avoid this is to enforce a strict trading plan with predefined rules, maximum daily loss limits, and mandatory breaks after losses.
How Goat Funded Trader Helps Traders Apply Their Chart Analysis Skills
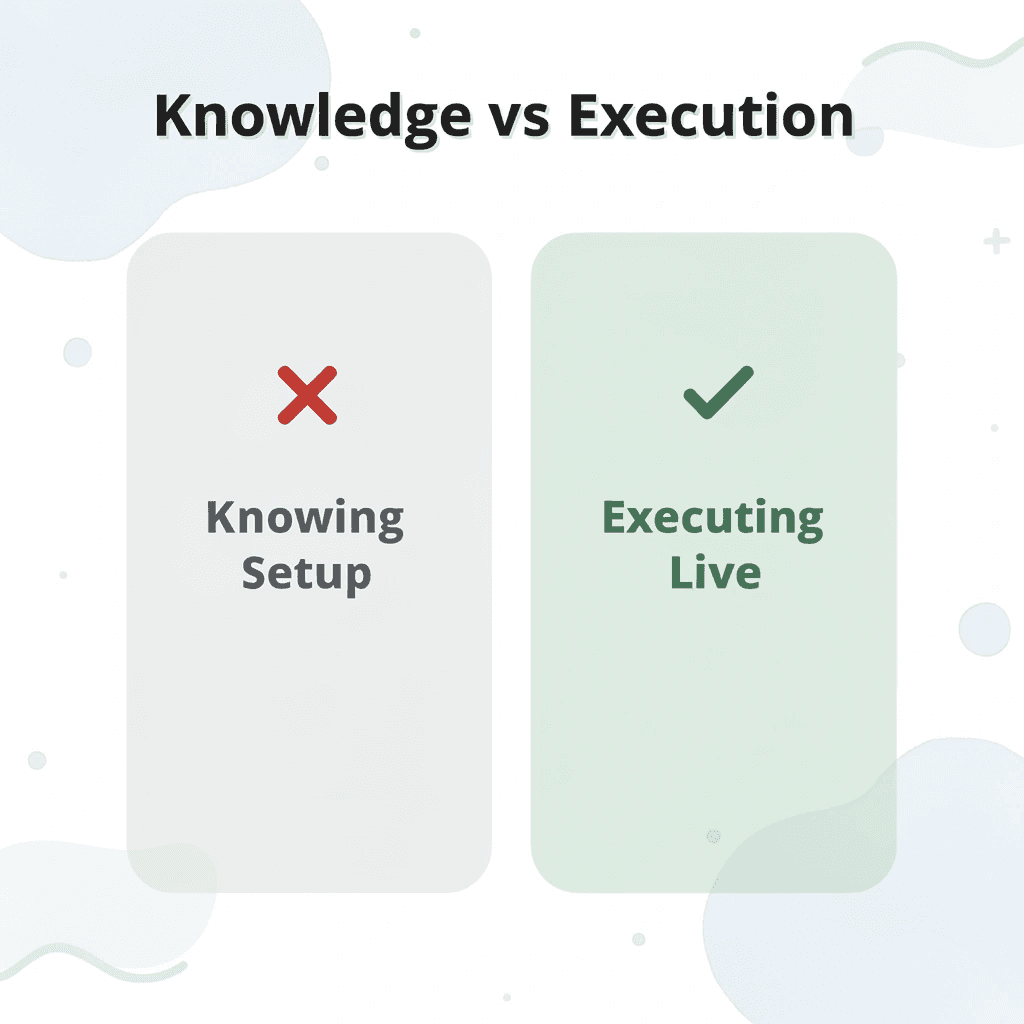
Chart analysis knowledge only pays off when you can act on it without hesitation. Goat Funded Trader closes the gap between knowing a setup and executing it under real market conditions by providing a structured environment where technical skills are tested, refined, and rewarded at scale.
"Chart analysis knowledge only pays off when you can act on it without hesitation — the gap between knowing and executing is where traders are made or broken." — Goat Funded Trader
🎯 Key Point: Goat Funded Trader doesn't just evaluate your knowledge — it bridges the critical gap between chart analysis theory and real-world trade execution, giving your technical skills a proven arena to perform.
💡 Tip: Use the structured evaluation environment at Goat Funded Trader to actively stress-test your setups — because technical skill only becomes an edge when it holds up under live market pressure.
Here is a breakdown of the different trading stages, what they test, and their ultimate outcomes:
- Chart Analysis: Tests pattern recognition and setup identification, leading to refined technical knowledge.
- Execution: Demands acting on setups without hesitation, resulting in consistent decision-making.
- Evaluation: Assesses performance under real market conditions, which is ultimately rewarded at scale.
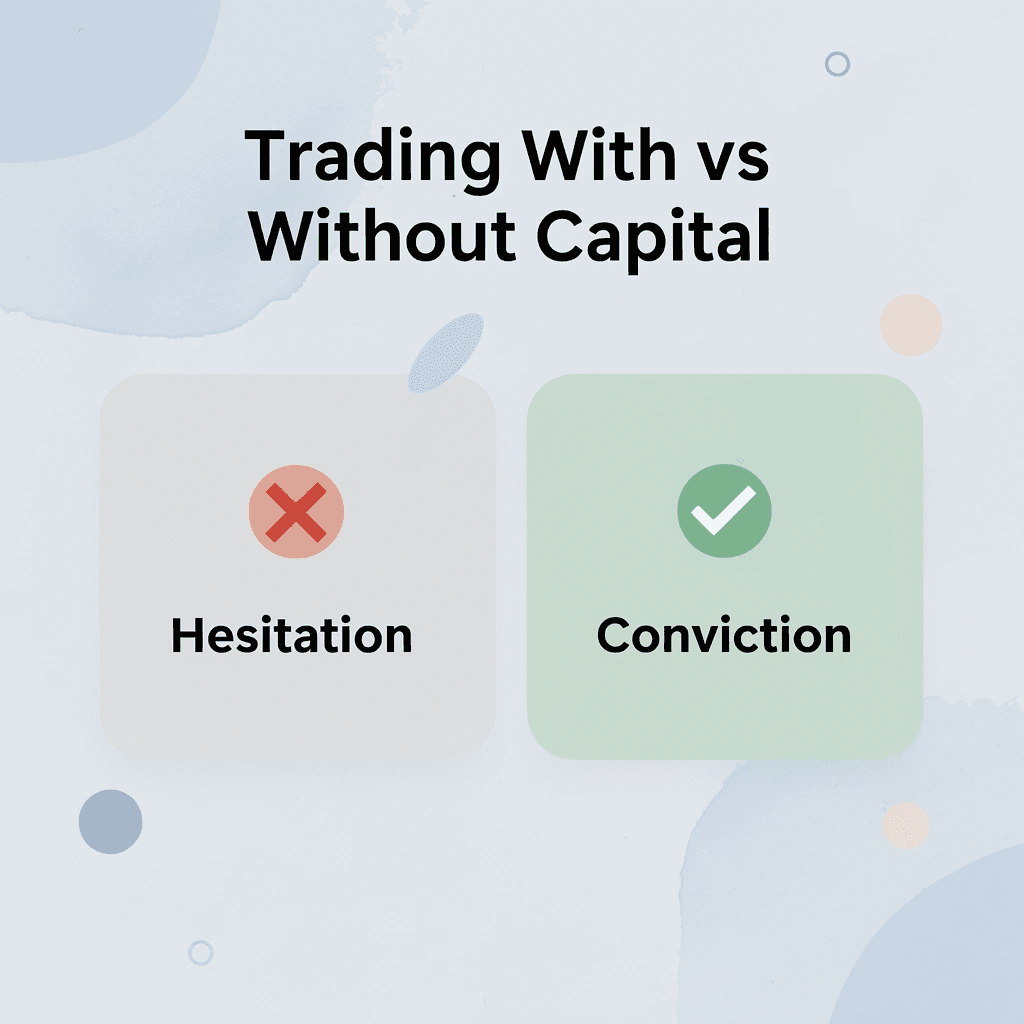
Why does capital size distort how to read crypto charts for day trading?
The failure point is almost always capital, not competence. A trader who correctly identifies a bullish engulfing candle on the 15-minute chart above a key support zone still hesitates when their entire account is one bad trade away from a margin call. That hesitation is not a character flaw; it is a rational response to an irrational constraint. When account size limits your ability to absorb normal drawdowns, you end up managing fear instead of managing trades. According to the Goat Funded Trader Blog, traders can access up to $800,000 in funded capital through Goat Funded Trader, which changes how traders approach short-term volatility and position sizing decisions.
How does undercapitalization erode the pattern recognition skills you built?
Most traders respond by trading with smaller amounts until position size becomes meaningless, or by overcompensating with oversized risk. Both distort the chart-reading skills they spent months developing. Every premature exit or skipped setup reinforces the wrong lesson, eroding confidence in pattern recognition.
Why strategy breadth matters more than most traders admit
Traders who know only one or two strategies force those patterns onto charts where they don't belong. A trader who trades only breakouts will see breakouts everywhere, including in choppy, low-volume conditions where price action is noise. According to Goat Funded Trader's guide to the most profitable trading strategies, 16 distinct trading strategies are covered because crypto markets rotate between trending phases, consolidation ranges, and high-impact volatility events that reward different approaches.
Traders who expand their strategy vocabulary read charts more accurately because they stop projecting a single bias onto price action. They recognize when a descending triangle is a genuine continuation pattern versus a false signal in a low-liquidity weekend session. Our prop firm tests those distinctions against real market structure, not backtested historical data alone.
The performance feedback loop that builds real skill
Constraint-based thinking applies here: if you trade with no performance data, you repeat the same mistakes with increasing confidence. When you track win rate by session, average risk-reward by setup type, and drawdown behavior by market condition, you stop guessing and start diagnosing. That diagnostic habit, built over weeks of consistent execution, transforms a trader who reads charts into one who trades them with repeatable precision. Technical skills around volume confirmation, candlestick patterns, and multi-timeframe trend alignment compound in value only when you can measure which conditions they perform best in. Most traders never reach this point because their trading environment was not designed to help them get there.
Get 25-30% off Today - Sign up to Get Access to up to $800K Today
The environment you trade in shapes the trader you become. When capital is limited, and every loss carries personal weight, even a well-read chart becomes difficult to act on with conviction. That gap between knowing what to do and doing it consistently is where most skilled traders stall — not because their analysis is wrong, but because the conditions around them were never built to reward precision.
"The gap between knowing what to do and doing it consistently is where most skilled traders stall — not because their analysis is wrong, but because the conditions around them were never built to reward precision."
🎯 Key Point: Trading psychology and capital conditions are as critical as technical skill. The right environment separates consistent execution from chronic hesitation.
Goat Funded Trader closes that gap directly. With up to $800,000 in simulated capital, a 3% daily loss limit, zero commissions on cryptos, and profit splits reaching 100%, you can apply multi-timeframe analysis, volume confirmation, and candlestick reads at size without fear. Use code FIRSTGFT for 25–30% off your first account and get funded in minutes.
Here is a breakdown of the key account features and their details:
- 💰 Max Capital: Provides up to $800,000 in simulated funds.
- 📉 Daily Loss Limit: Set at 3% to ensure structured risk management.
- 🚫 Commissions: Features zero commissions on crypto trades.
- 💸 Profit Split: Allows up to 100% of the profits to go to the trader.
- 🏷️ Discount Code: Use FIRSTGFT to get 25–30% off your first account.
- ⚡ Funding Speed: Designed so you can get funded in minutes.
💡 Tip: Use code FIRSTGFT at checkout to unlock 25–30% off your first account — one of the fastest and most cost-effective ways to access up to $800,000 in trading capital today.
✅ Best Practice: Pair your multi-timeframe analysis and volume confirmation skills with a funded account structure — trade at size, without the personal financial risk that clouds decision-making.
Related Reading
- Best Trading Apps For Beginners
- Best Demo Trading Account
- Risk Management In Stock Trading
- How Do You Manage Risk In Futures Trading
- Best Stock Trading App For Beginners
- How To Make Money Trading Crypto
- How To Learn Crypto Trading
- Best Crypto Trading App
- Best Day Trading App For Beginners
Be Great and get the App


.webp)


